
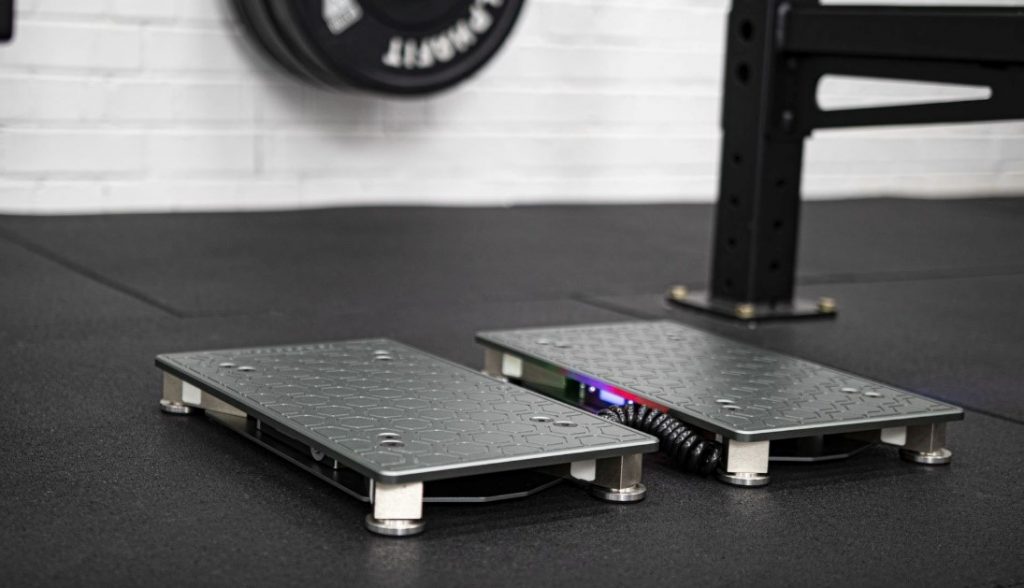
All pitchers want to know the best way to throw harder. Some think that you need to lift heavy all year round, some believe that speed and plyometric training is more important. While there is nothing wrong with either of these approaches, the answer lies in the middle and that is Power. Training Power is key during the offseason when it comes to throwing hard and overall being a more complete athlete. One may ask how you determine someone’s power, and we do that through Vald’s ForceDecks Force Plates. Giving us metrics such as Force, Velocity, and Power, we can see where the athlete needs to improve to ultimately up their Power Output.
Upon completion of the table portion of the assessment, we head over to the Force Plates where we complete 3 tests. These tests include:
-
- Countermovement Jump (CMJ)
- Squat Jump
- Single Leg Drop Jump
We also perform a 10-5 Hop Test, and I will discuss why we do this later on. But first, let’s dive into our main assessment tests.
Countermovement Jump (CMJ)
The first test we complete is a CMJ Jump. This jump is performed to test the athlete’s ability to utilize their Stretch Shortening Cycle and relates to the velocity portion of the power equation and ultimately gives us the athletes force/velo profile (see below). The hands are kept on the hips to test pure lower body recruitment. The athlete goes into a squat position (around 90 degrees), and is given the cue “jump as fast and as high as you can”. The depth they choose, either deep or shallow, can tell us a lot about their strategy for loading in order to best utilize their SSC to help produce power.
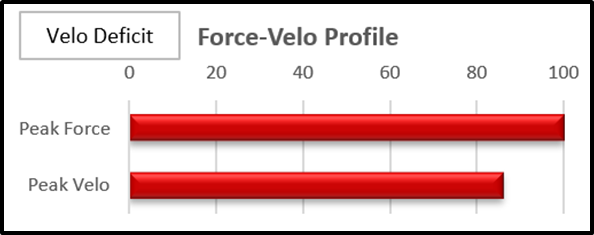
We use the CMJ Jump to analyze if the athlete leans one way or the other on the Force-Velocity Curve, whether they are in a Force-Deficit or Velo-Deficit. Ideally, we look for our athletes Force and Velocity Profiles to be between 10-15% of each other. Below is a chart we use to analyze where the athlete falls.
The athlete above exhibits 100th percentile strength with 86th percentile velocity. Therefore, we would deem him well-balanced because there is a 14% difference in his Force and Velocity numbers. We will still address his velocity and be more plyometric and power training – based in his programs.
Squat Jump
The second test we perform is a Squat Jump. This jump is performed to test the athlete’s ability to use muscular force and relates to the force side of the power equation and Force-Velocity Curve. Once again with the hands on the hips the athlete gets into the bottom position of a squat position (around 90 degrees), then completes a 3 second hold before jumping. This removes the athlete’s ability to use the SSC by causing the energy built up in the muscle spindle to dissipate as heat and forces them to use mostly muscular contraction to produce their power.
Metrics we analyze on the Force Decks for these tests are:
-
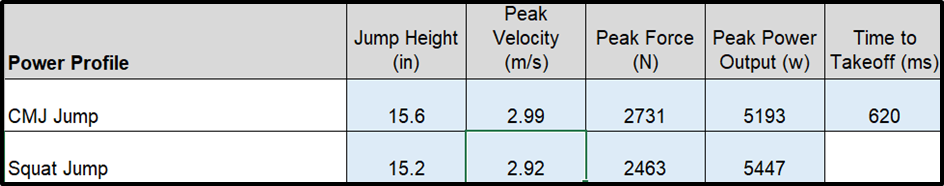
- Jump Height Imp-Mom (inches): Jump Height Calculated from the Velocity of the Center of Mass at the instant of Takeoff and Body Mass (CMJ and Squat Jump)
- Concentric Peak Velocity (m/s): Maximum Velocity during the Concentric Phase of the Jump (CMJ and Squat Jump)
- Concentric Peak Force (N): Maximum Vertical Force during the Concentric Phase of the Jump (CMJ Jump Only)
- Takeoff Peak Force (N): Maximum Vertical Force between the Start of the Movement and Takeoff (Squat Jump Only)
- Peak Power (W): Maximum Power during the Concentric Phase of the Jump (CMJ and Squat Jump)
- Contraction Time (ms): Time Period from Start of Movement to Takeoff (CMJ Jump Only)
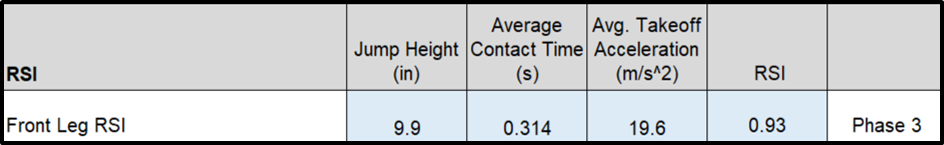
Single Leg Drop Jump
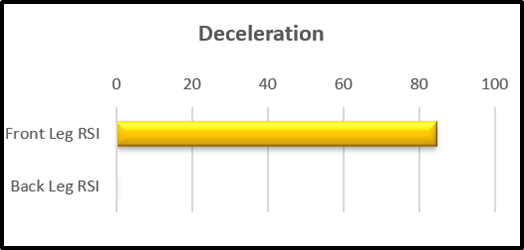
This test looks at the ability of the athlete’s lead leg to hit the brakes immediately at foot plant and in turn transfer force back up the kinetic chain to use during the throw, or in the case of the test, how high and how fast they can jump on their front leg. During this test, to best simulate the slope of the mound, we have the athlete jump off a 4 inch riser onto the ForceDecks to see how quickly and high they can react to the drop. Based upon the results, we can try possible heel first or flat foot landings with the lead leg to better help a better decel/post-up. We classify the athletes from Phase 1 – Phase 5 in terms of RSI and plyometric ability.
Metrics we analyze for this test are:
-
- Jump Height Imp-Mom (inches): Jump Height Calculated from the Velocity of the Center of Mass at the instant of Takeoff and Body Mass
- Contact Time (s): Time period between Drop Landing and Takeoff
- Peak Takeoff Acceleration (m/s²): Maximum Acceleration of the Center of Mass between Drop Landing and Takeoff
- RSI (Jump Height * Flight Time)/Contact Time) (m/s): Ratio of Jump Height (Flight Time) to Contact Time
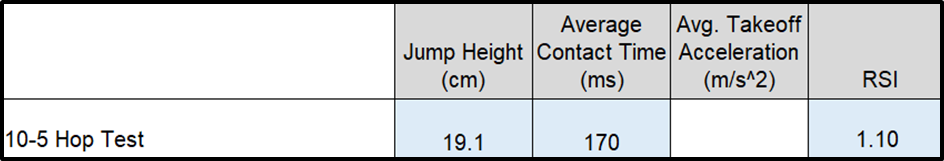
10-5 Hop Test
What we call the 10-5 Hop Test, also known as a Pogo Jump Test, is a test we use at the beginning of the offseason and its purpose is to evaluate our athlete’s Central Nervous System and see how they will perform on any given day. We also use the test to evaluate how quickly the athlete can produce force. We have the athlete stand with their hands on their hips and they will complete 10 consecutive pogo jumps, jumping as high and as quick as they can without bending their knees.
After completing this at the beginning of the offseason, we now have baseline numbers when the athlete is fresh that we use to compare as we progress through offseason throwing. When we get into our Velo Phase in January where we complete pulldowns and mound velos, we will retest the athlete and compare their numbers to their baseline assessment.
If the athlete is within 10% of their baseline numbers, they are good to complete their throwing as is. If the athlete is between 10-20% worse than their initial assessment, their volume will be cut in half. And lastly, if the athlete is 20+% worse than their initial assessment, they will complete a recovery throwing day as their CNS will only allow them to throw as hard as they are fatigued. We do this to prevent injury and make sure the athlete is
always performing at or near 100%.
Closing
Developing strength, speed and explosiveness in athletes is purely physics. Applying these traits to basic anatomical attributes can get a bit complicated but at the end of the day it’s all about force, velocity, and ultimately power. When it comes to training athletes in an explosive sport such as baseball, understanding how the athlete creates power through either force or velocity has a great deal to do with how they should train in the weight room. So, finding which trait, force or velocity, the athlete has a larger deficiency is the concept behind improving Peak Power Output.
By using our Vald ForceDecks Force Plates, we can measure power production as well as the peak velocities the athletes are moving which can help us better understand which side of power (force or velocity) the athlete relies on more and adjust training to give them more of what they need. In this way, we can actually shift an athlete’s force-velocity curve one way or another to help them create the perfect combination to become more explosive.
By Matthew Hartshorn (Pitching Coordinator)
You live too far to train with us in-house at RPP? You can now train with us on a REMOTE basis.

You can also reach us through our various platforms or simply click below to schedule a phone call.

If you’re interested in receiving our blogs, please enter your email address below!