
Most often pitchers and position players associate their pitching velocity, bat speed or exit velo with their pitching or hitting mechanics. As our understanding of the body and technology has improved over the years, it is now more apparent than ever that your velocity ceiling, whether it’s pitching or hitting, is limited by your physical ability more than anything else.
If your velo is stuck… let’s find out why!
First let’s be clear, there isn’t a “one-size-fits-all” solution when it comes to coaching pitchers or players in the weight room. As a result, our in-house “assessment”, covers an extensive range of topics that helps us determine the overall mobility, elasticity, physicality, and strength and power production of our athletes. The information provides an excellent roadmap when developing a customized training program catered to the needs of each athlete.
In general terms, the assessment includes the following:
-
- Anthropometrics
- Mobility – Lower and Upper Half
- Strength – Lower and Upper Half
- Power – Lower and Upper Half
- Elasticity – Lower and Upper Half
- Speed
- Deceleration
- Body Fat % and Mass Ratios
- Force Velocity Profile
By the time an athlete has completed our evaluation, we have an excellent idea of where his strengths and weaknesses are from a physical standpoint. There is NO better blueprint. Here is a brief video on the evaluation:
In addition, given our historical intake of this type of information, we have assembled target ranges for each, and every metric based on age and level. This in turn allows us to, not only develop a complete plan but also, immediately identify the lowest hanging fruit to improve performance.
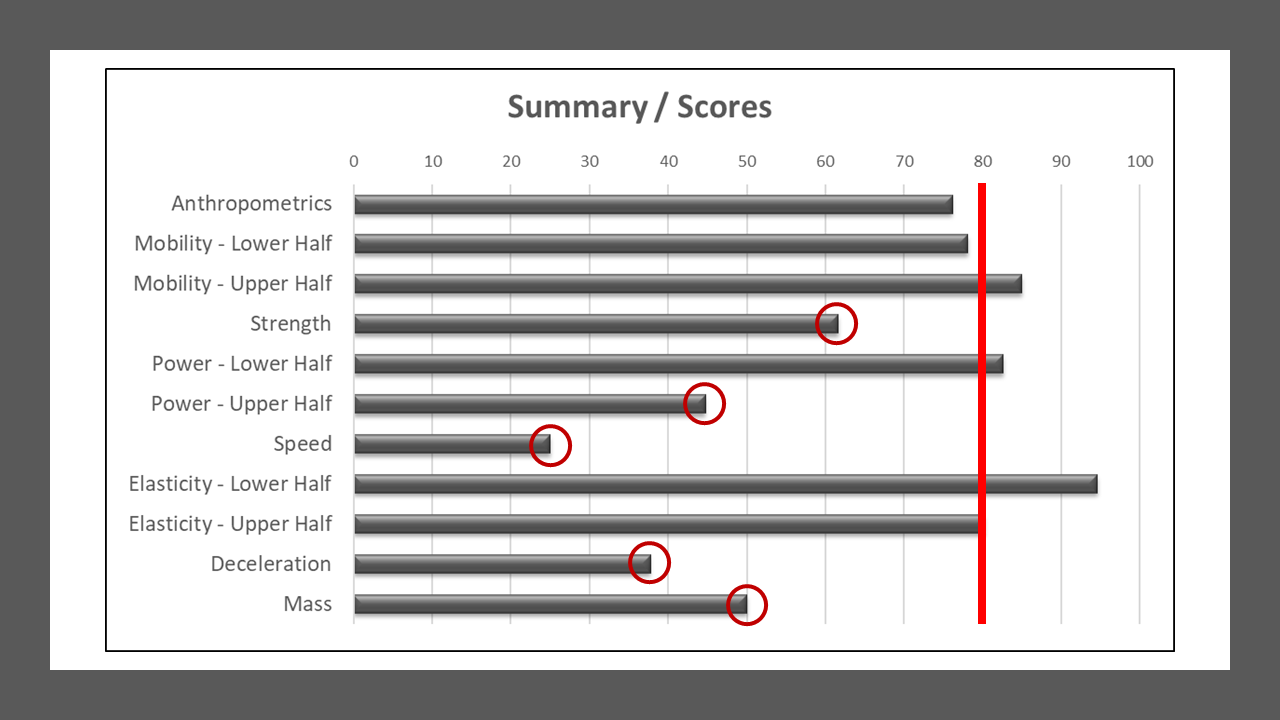
The metrics listed below are based on a Scale of 100. These ratings allow us to identify the areas with the greatest room for improvement. As each athlete relies on different degrees of these metrics to create their personal levels of athleticism, being able to see room for improvement at-a-glance is key in order to create a more efficient program that addresses each athlete’s individual needs. It also provides the athlete with an aha! moment, when they feel stuck at a given velocity.
Let’s take a look…
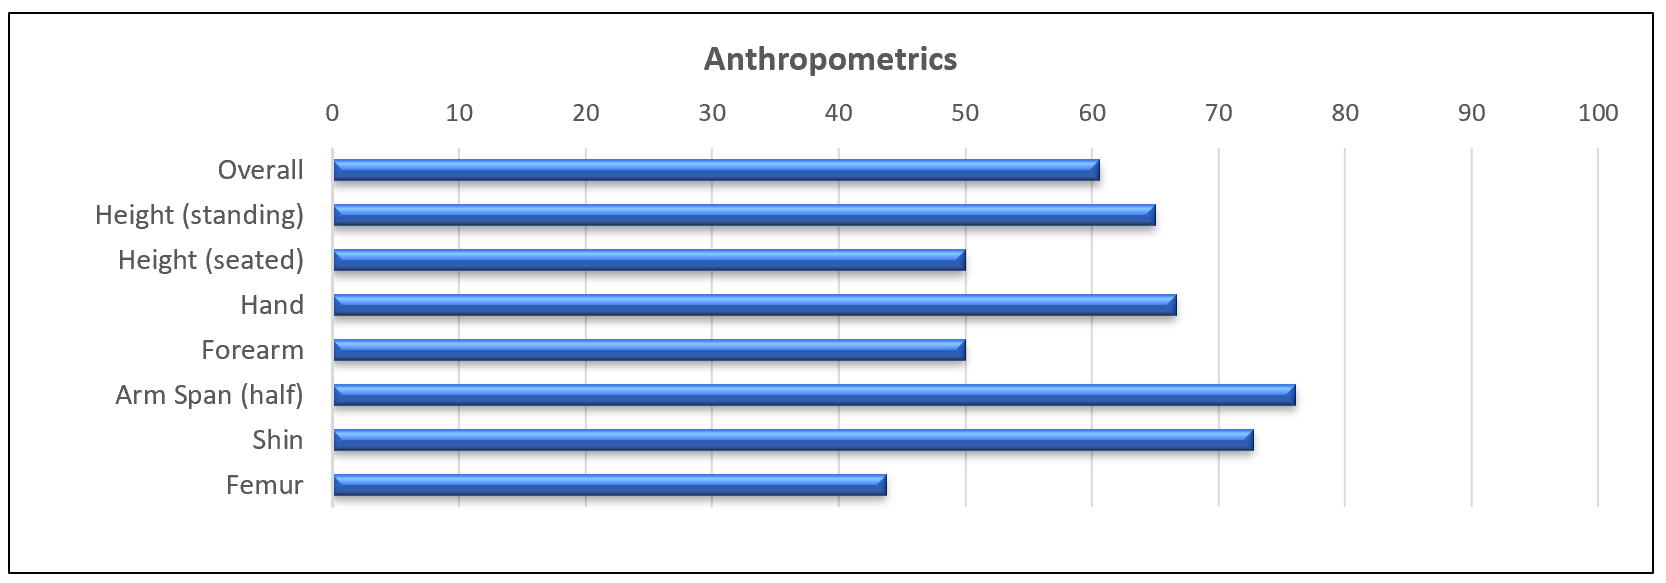
Anthropometrics
Anthropometrics is a term used to describe the physical measurements of an individual’s size. The measurements tell us about the athlete’s overall frame. Would you tell a short pitcher to train and throw the same way as a tall pitcher? Two ball players can deliver Major League velocities but do so with completely different frames and mechanics. Thus, your mechanics can and will vary between taller and shorter athletes.
Tall (approx. 6’4” and taller)
-
- Generally, have longer limbs
- More mobility / flexibility (laxity)
- Generally weaker from a strength standpoint in the weight room
Short (approx. 6’0” and under)
-
- Generally, have shorter limbs
- Less mobility
- Much stronger in the weight room
Since anthropometrics is the least trainable trait, it becomes the major factor to base the overall training program, in both the weight room, on the mound or at the plate. Below is an example of the various attributes we measure:
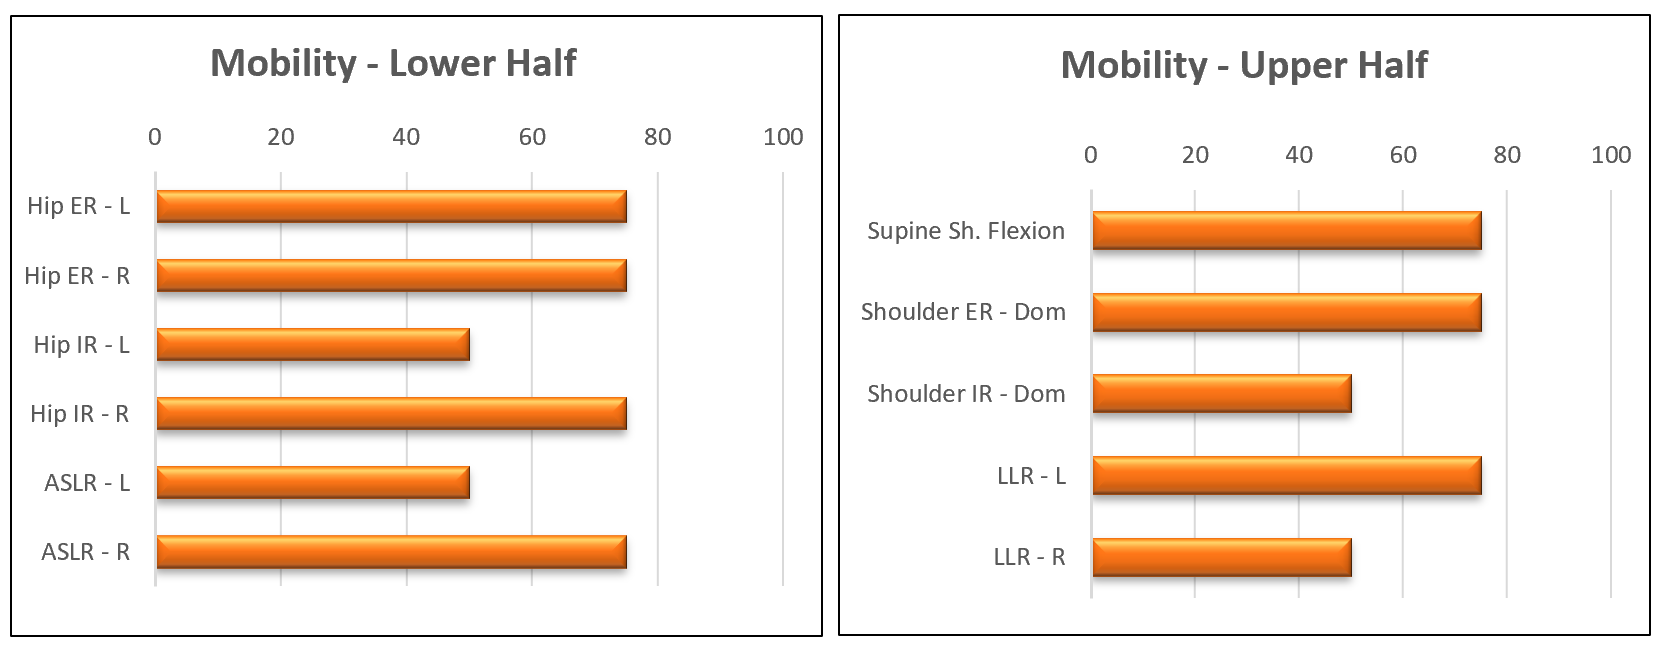
Mobility
The next time you watch an MLB player with a throwing velo or exit velocity of 100 mph, watch closely how his body moves through his delivery. You can’t generate power and perform at your highest potential in these types of positions without adequate mobility in all the right places…
-
- Hip Mobility
- Shoulder Mobility
- T-Spine Mobility
An important thing to note is more is not always better, especially when we are dealing with taller, “looser” athletes with longer levers (limbs). In this case too much mobility can create instability and a lack of control in their mechanics as well as increasing the chance for injury.
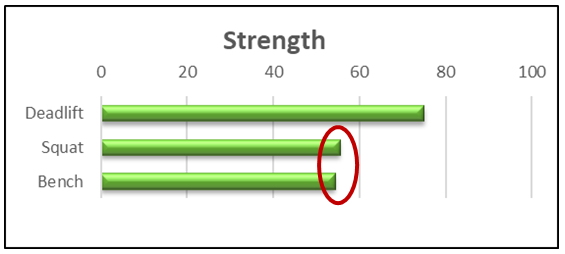
Strength
Your strength levels are a big part of your maximum potential as a pitcher or a position player. The deadlift, single leg squat and bench press are generally the gold standards for gauging overall body strength.
Without adequate levels of body strength, it’s difficult to perform at higher levels. But, once again, there is an upper limit on this range, meaning that you can have too much of a good thing, especially for our taller, looser athletes that rely more on elasticity and mobility to be successful. For these guys, maybe focusing on using loads that are a bit lighter and are closer to the velocity end of the force-velocity curve is more optimal.
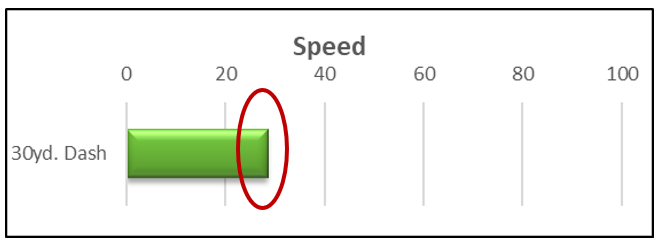
Speed
Although, this is a measurement generally associated with position players, we believe that it provides us with good measurement for overall athleticism, which is important regardless of what position you play on the field. While we do keep this lower on the totem pole of things to address, a good dose of speed is always a good thing for ball players.
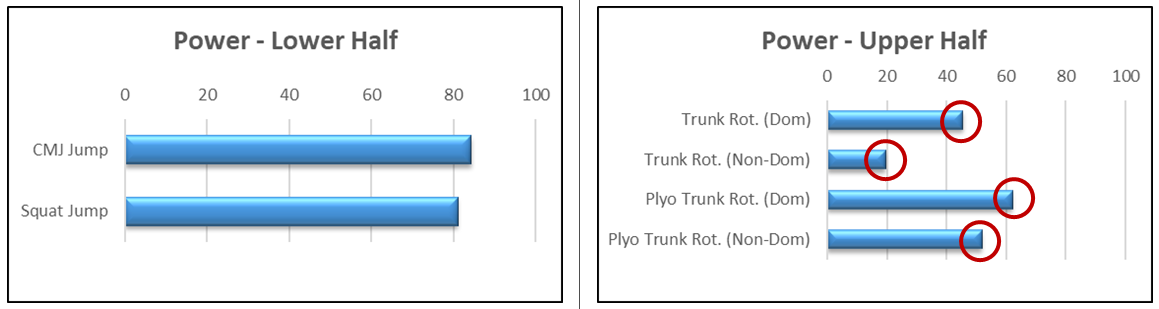
Power
Power is the combination of strength and speed. Whether it be throwing, hitting or running, all power initiates in the core, transferring to the lower body prior to being transferred up the kinetic chain and ultimately into the arm and hands.
-
- Lower body power (along with lateral power) is the biggest determining factor for throwing velocity as well as first-step quickness and change-of-direction abilities. We measure lower body power using VALD Force Plates which allows us to determine how much wattage your lower half can produce.
- Upper body power is also a great indicator as to how fast we can produce strength up top. This is directly correlated to trunk rotation as well as a harder and faster transfer from lay back to pronation during the throw. This allows us to maximize the highest amount of power being transferred from the lower body as well as not overusing the arm. Ironically, this is one metric many pitchers perform poorly on. With the introduction of the Proteus Motion machine, we can now also measure power production in the upper half as well. This is a game changer, especially when it comes to assessing and training rotational athletes like pitchers and position players.
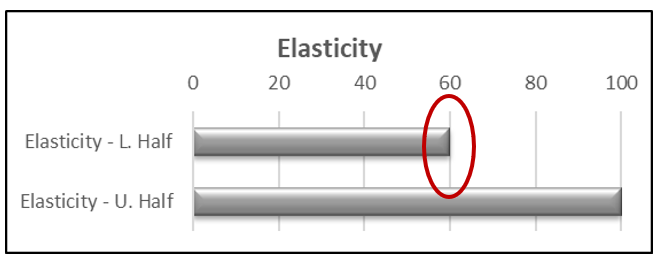
Elasticity
Elastic energy is the body’s ability to store and release energy from connective tissues, namely the tendons. How quickly this process happens is due to the large “cross-sectional area” (CSA) of the tendons and is vital to explosive performance on the mound and on the field.
Different type athletes will possess different degrees of CSA of these tendons allowing some to have naturally “whippier” arms. Athletes with good tendon strength (stiffness) can guard from exceeding their passive restraints and are less likely to get injured as well. As a result, we use several tests to see how fast or “elastic” each athlete is.
For the lower half, we implement the CMJ / Squat Test for elasticity bilaterally (2 legs) and the back leg Heiden for unilateral. This helps us determine the athlete’s ability to use the stretch-shortening cycle (SSC) in transitioning from eccentric to concentric movements. It also helps identify what type of loading speed for the back leg an athlete may be more efficient with either a longer/slower load or a later/quicker load. We can also gauge which level of plyometric training is appropriate and program accordingly.
All testing for upper half / core elasticity is performed on the Proteus Motion machine using counter and non-counter movements.
The results of the elasticity tests help us determine the reactive ability of the athlete and plyo phase they should be placed into during the training:
-
- Phase 1 – Low Reactive Ability, emphasis on eccentric strength and landing mechanics
- Phase 2 – Moderate Reactive Ability (stiff-joint, low impact), Introduction to utilizing the stretch-shortening cycle
- Phase 3 – High Reactive Ability- High speed, short GCT (<.250 ms), sub-maximal loading. Begin to utilize sport-spec. movements
- Phase 4 – Elite Reactive Ability (no plyos), Time is better spent on other aspects of training (strength, technique etc.)
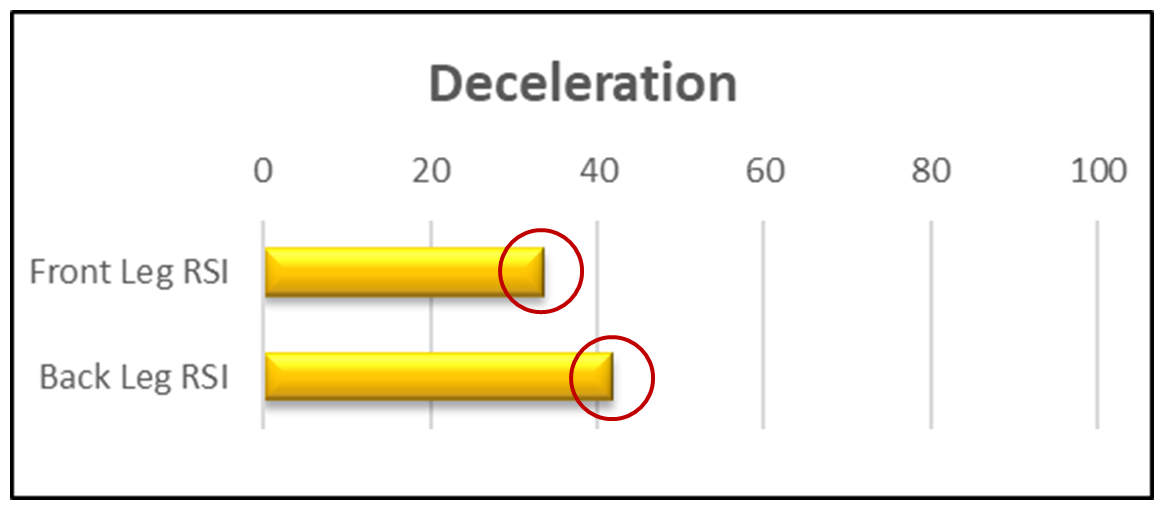
Deceleration
This is basically the athlete’s ability to “hit the brakes” (decel) when the front foot lands at foot plant. An athlete will only hit the gas coming down the mound based on his ability to put on the brakes. The quicker we can stop the body (decelerating), the more efficiently the arm can get into layback and ultimately unwind into release.
From a mechanics perspective, an athlete with less efficient deceleration properties on the front leg will many times be more successful with a bit of a “heel first” landing. This makes deceleration one of the major players in all things velo.
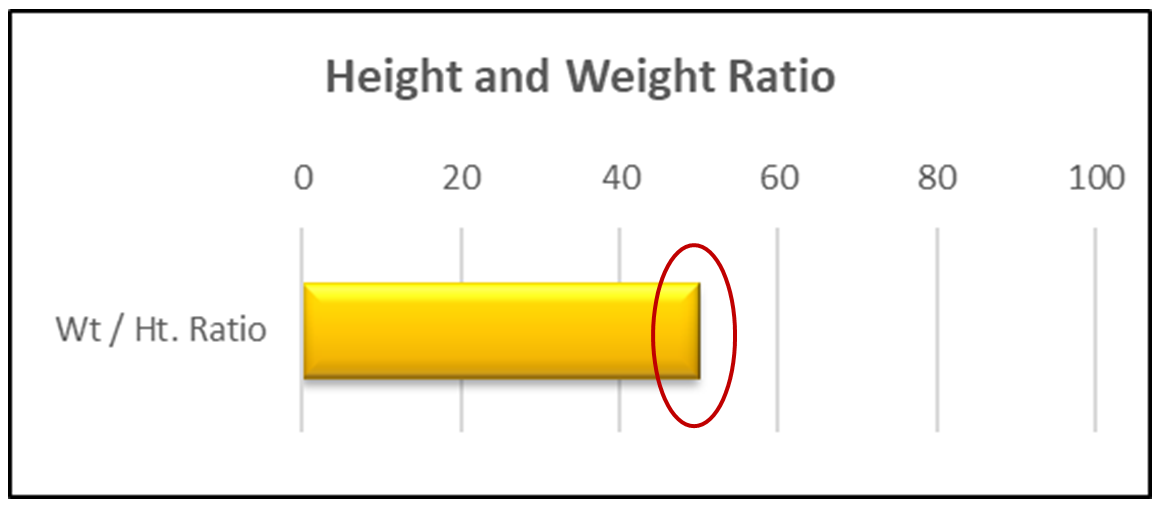
Body Fat % and Height and Weight Ratio
In a study from 2019-2021, of the 39 MLB pitchers with at least 50 innings pitched who averaged 96+ mph, only 7 were listed under 200 lbs. and only 2 under 185! To move explosively through space requires an optimal level of power (a solid amount of muscle) and a minimal level of dead weight (body fat).
Most major league players sit anywhere between 12-15% body fat. Lean body weight is always a contributing factor to throwing velocity and in fact it is right up there with lateral jump distance as being the best predictor of throwing velocity.
With respect to height to weight ratio, we are generally looking for a 2.5-3.0x ratio for high performance athletes.
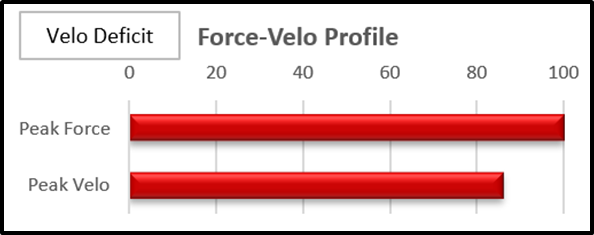
Force-Velo Profile
The equation for Power is Force x Velocity. This basically means your Power is determined by how much force (strength) you are capable of producing and how fast (velocity) you can generate it.
All athletes rely more of one side of this equation (force or power) than the other to create the best type of power to excel at their sport. Through our force plate and strength testing, we can determine which side an athlete relies more on force or velocity, and focus more on training what they need while maintaining what he relies on when programming.
Summary Report
The summary chart listed below provides us with an excellent roadmap for tracking the lowest hanging fruit. As an example, you can see from the chart below, this specific athlete has 5 areas with the lowest hanging fruit. These will be the primary areas we begin to address in his programming, while using anthropometric measurements to better understand the levers the athlete may need to adjust to get into more successful positions.
The bottom line is, different athletes rely on different attributes to be efficient. Understanding that and “maintaining” those metrics while bringing up others can help create more healthy and explosive athletes with higher ceilings.
See ya’ in the gym…
Source: Graeme Lehman “Pitcher’s Physical Profile Testing Sheet”
By Nunzio Signore and Bahram Shirazi
You live too far to train with us in-house at RPP? You can now train with us on a REMOTE basis.

You can also reach us through our various platforms or simply click below to schedule a phone call.

If you’re interested in receiving our blogs, please enter your email address below!