

Advancements in baseball technology now allow us to analyze swings in unprecedented detail. At RPP, we leverage tools like Blast Motion, HitTrax, and K-Vest to provide comprehensive insights into a player’s swing, helping hitters reach their full potential. Our new hitting report evaluates critical areas such as bat speed, launch angle, contact quality, and swing mechanics, offering a clear path for improvement.
The purpose of this report is straightforward: to help hitters understand their strengths and areas for development, enabling them to refine their approach for greater consistency and power. The report includes detailed charts, graphs, and data points, translating complex information into clear, actionable insights. It is structured as follows:
1. Blast Motion
-
- Summary Table
- Rotation (power)
- Connection
- Plane
2. HitTrax
-
- Summary Table
- Relative Graphics
3. K-Vest
-
- Body Position Tables
We will use RPP athlete and Rutgers University center fielder Pete Durocher as a case study to illustrate key concepts. In the past three seasons (two at Manhattan College and one at Rutgers), Pete has put up impressive numbers, including a .334 batting average, .396 OBP, .499 SLG, and .895 OPS. He is doing many things well at the collegiate level, so let’s dive into what helps him be so successful.
1. Blast Motion
For more information or clarification on any of the following metrics, please click this link for an in-depth explanation of all things related to Blast Motion data
a) Summary Table
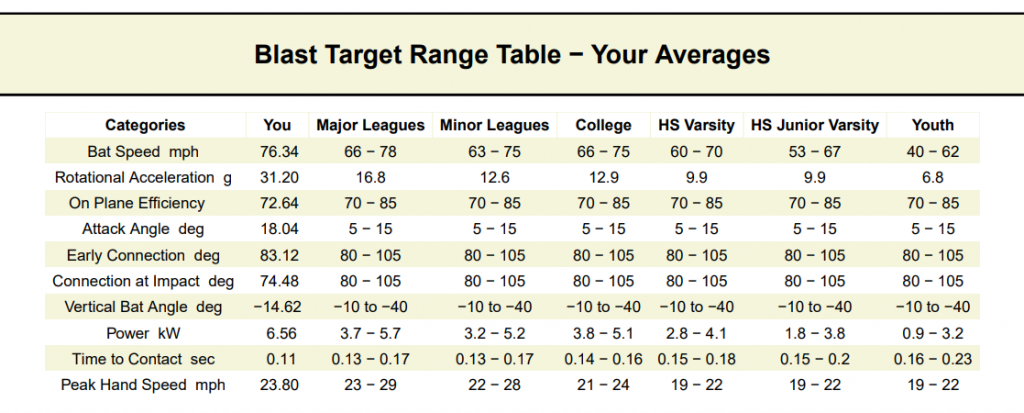
First, we see a summary breakdown of Pete’s metrics. As we can see, he has some impressive numbers that fall within or exceed the ‘Major League’ ranges. It is important to note that these are all averages. Additionally, all the data presented for each level is expected to be in-game data, so some of your metrics may be slightly skewed since these reports are taken from a machine setting.
b) Rotation (power)
Bat Speed and Rotational Acceleration are evaluated under Blast’s ‘Rotation (Power)’ category. Excelling in these two metrics allows the hitter to generate more power at contact and maximize the time required to react to pitches.
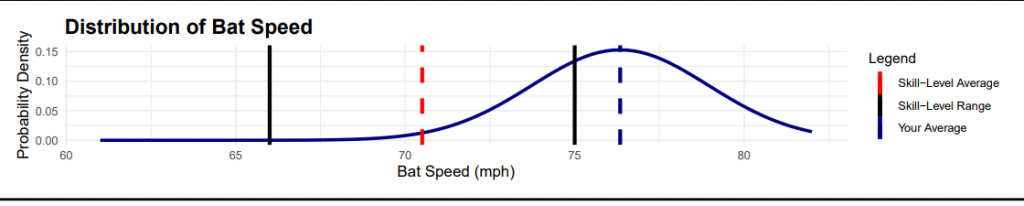
In the first chart, we see Pete’s distribution of bat speed. Compared with the suggested range for college athletes, he performs very well. His average is beyond the upper range for college athletes, and his maximum extends even further.
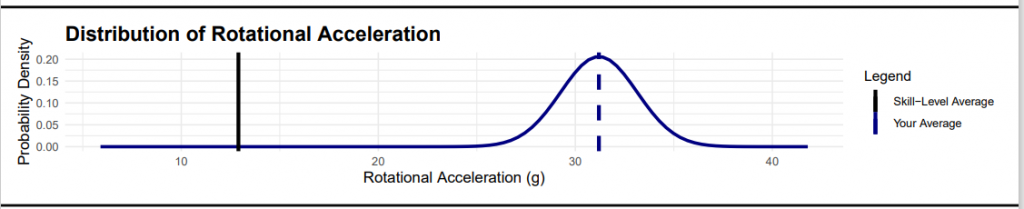
In the rotational acceleration table, where we once again see Pete well beyond the target.
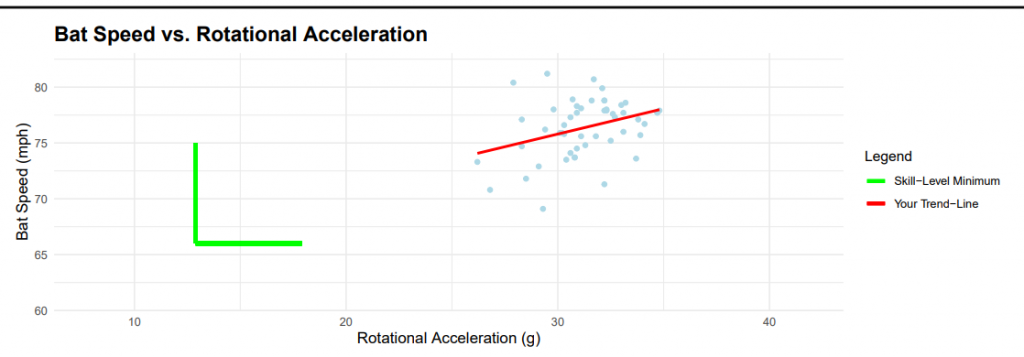
In the third chart, we see a combination of both bat speed and rotational acceleration. The goal is to be above the target in both metrics while showing a trend where, as bat speed increases, rotational acceleration also increases, and vice versa. This indicates that we are not compensating in our swing to achieve either of these metrics.
c) Connection (Consistency)
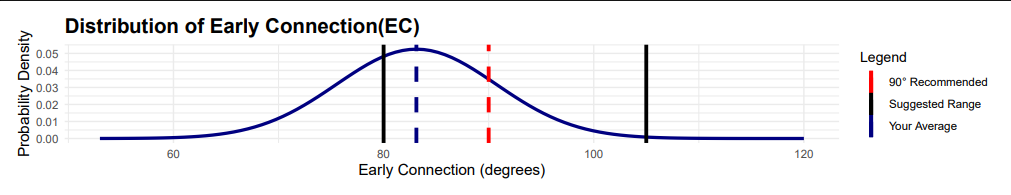
Connection is broken into two categories, as demonstrated in the first two charts: early connection and connection at impact.
Net connection is defined as the absolute value of early connection minus connection at impact, and ideally, this difference is less than 15 degrees. Achieving the target connection allows hitters to be more adjustable, and effectively cover more of the plate.
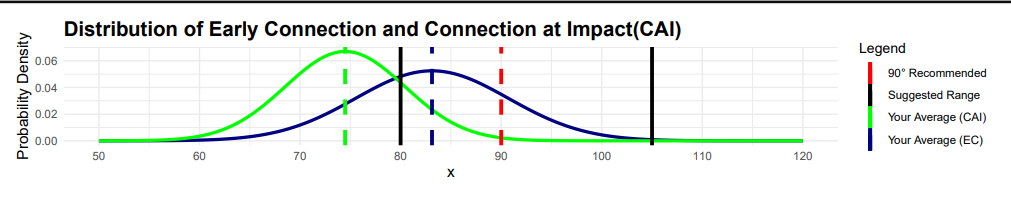
When looking at Pete’s numbers, we see that his early connection falls within the range and is close to the optimal angle of 90 degrees. However, the second graph shows that his connection at impact falls slightly out of range, though it is within 15 degrees of the early connection, so it is still acceptable.
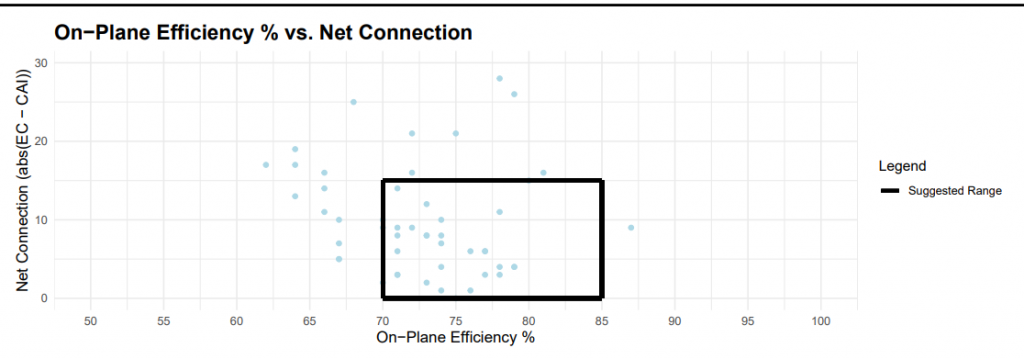
The low connection at impact could be due to compensating for pitch location, or, after video analysis, we may uncover a mechanical flaw. Lastly, in the third chart, we compare ‘Net Connection’ with ‘On-Plane Efficiency’. Although on-plane efficiency corresponds to the following section (Plane), comparing these two metrics allows us to see if our bat-path suffers as our connection worsens.
With Pete, we see a desirable trend: as his net connection decreases, his on-plane efficiency increases.
d) Plane (Contact)
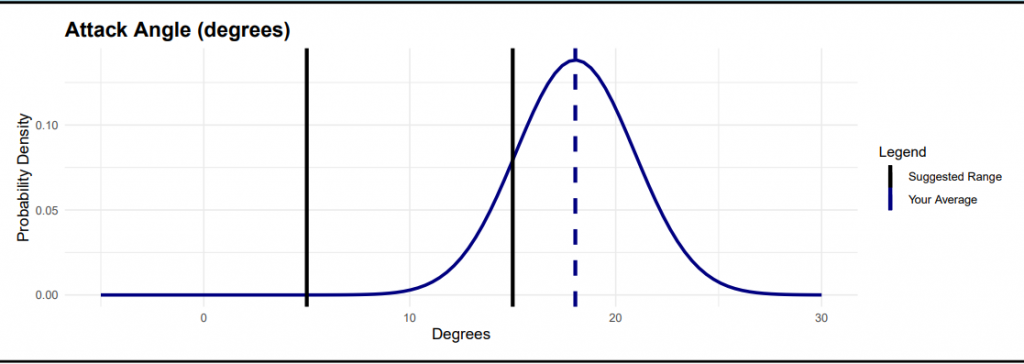
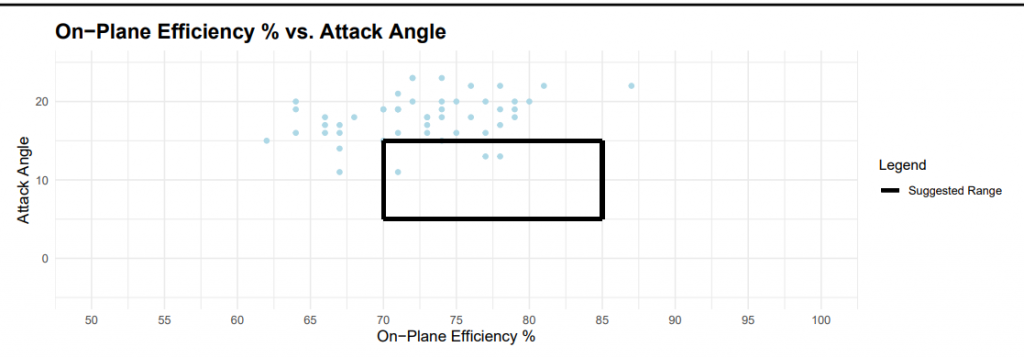
To conclude our Blast Motion section, we looked into attack angles paired with on-plane efficiency. The ideal attack angle remains the same across all levels, between 5-15 degrees.
Maintaining a flatter attack angle within this range allows hitters to match the plane of both fastballs and off-speed pitches. Here we see an area that could help improve Pete’s already successful swing.
Currently, his average swing tends to be on the steeper end, which reduces the margin for error on fastballs. With this current attack angle, timing on fastballs needs to be nearly perfect, and he may prefer hitting off-speed pitches when seeking his best contact.
When looking at his on-plane efficiency, we see that his efficiency is satisfactory but is on-plane with this steep attack angle. If possible, we would like to maintain this same on-plane efficiency while slightly flattening his attack angle.
2. HitTrax
HitTrax: While Blast Motion accounts for everything that occurs before contact, HitTrax analyzes everything after the point of contact. Here we will see if the hitter’s mechanics translate to proper ball flight and exit velocities while also identifying their strengths and weaknesses.
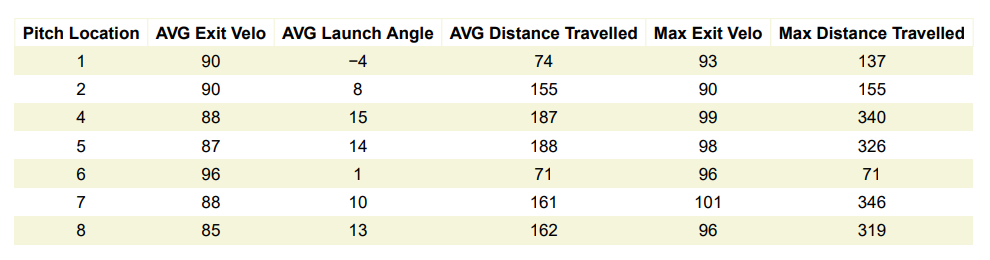
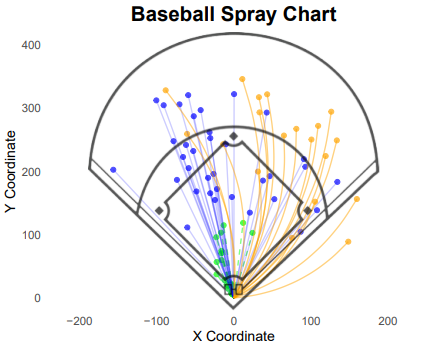
The diagram and table above show the basic information provided by HitTrax. By looking at the table, we see that every batted ball is broken down into launch angle, exit velocity, and distance. When looking at the field, it is important to note that the scaling of the infield may be larger than it is in real life. Nonetheless, the field shows how far every batted ball traveled in the air. The average and maximum exit velocities are very solid, as expected, especially considering that the machine baseballs being used are not as high quality as game balls.
With the balls used at the college level, Pete would likely have seen both numbers higher. One interesting observation is the trend of his ball flight. It seems that Pete is hitting most of his line drives to left-center while many fly balls go to right field. Without watching the rounds of batting practice, conclusions cannot be drawn, but this trend might align with what we found in the Blast Motion section regarding Pete’s connection and attack angle.
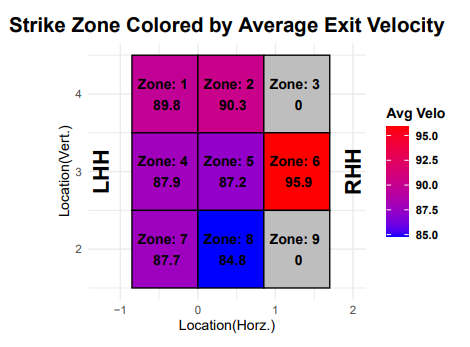
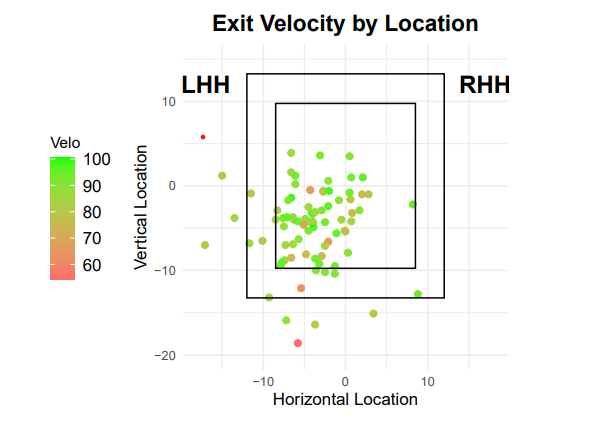
In the first display, we see the exit velocities displayed from the table in the previous section. This provides a good visual for the hitter to see where they may hit balls the best, or conversely, where they struggle in the zone.
The second chart aims to provide the same visual while including all batted balls, even those outside the zone. With this, we can see if the hitter is struggling to lay off pitches out of the zone.
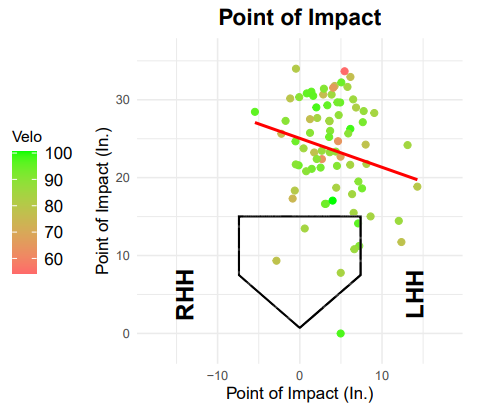
Finally, the point of impact chart shows how the hitter is handling pitches in different locations. Ideally, we want the hitter to make contact with inside pitches slightly in front of the plate and outside pitches deeper in the swing plane. As we can see, nearly every point of contact is way in front of the plate, suggesting Pete may have been standing far up in the box. However, it is still positive that we see his trend line moving in the correct direction.
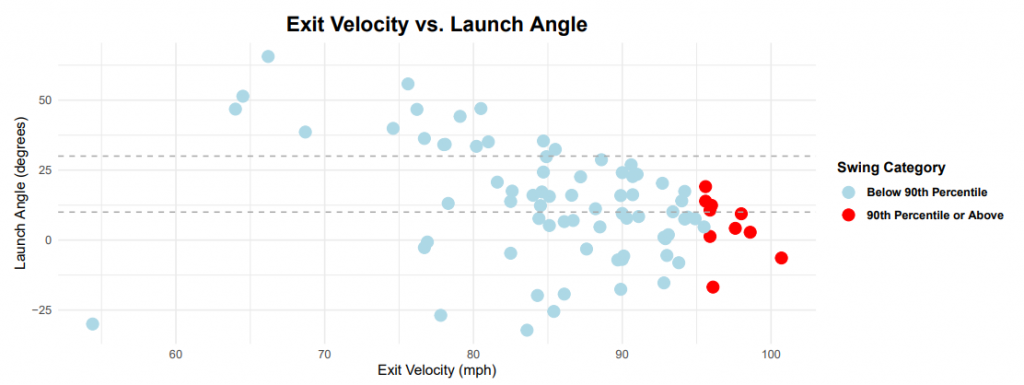
To wrap up HitTrax, we have a scatter plot showing the trends of hitters and the flight of their hardest-hit balls. With Pete, we see that he does an excellent job of hitting balls within our ideal launch angle range, and it is very rare for him to hit uncompetitive pop-ups or fly balls.
As hitters move on to higher levels and develop more power, there is more room for a higher launch angle, as those balls will turn into home runs.
3. K-Vest
*** For more information regarding what K-Vest Motion metrics, please see the following two links:
When creating this report, we encountered a challenge, as the K-Vest software does not allow us to export the necessary data to make graphs showing the velocity and rotational acceleration of the hitter throughout the swing. However, we were able to create representations to analyze posture throughout the swing.
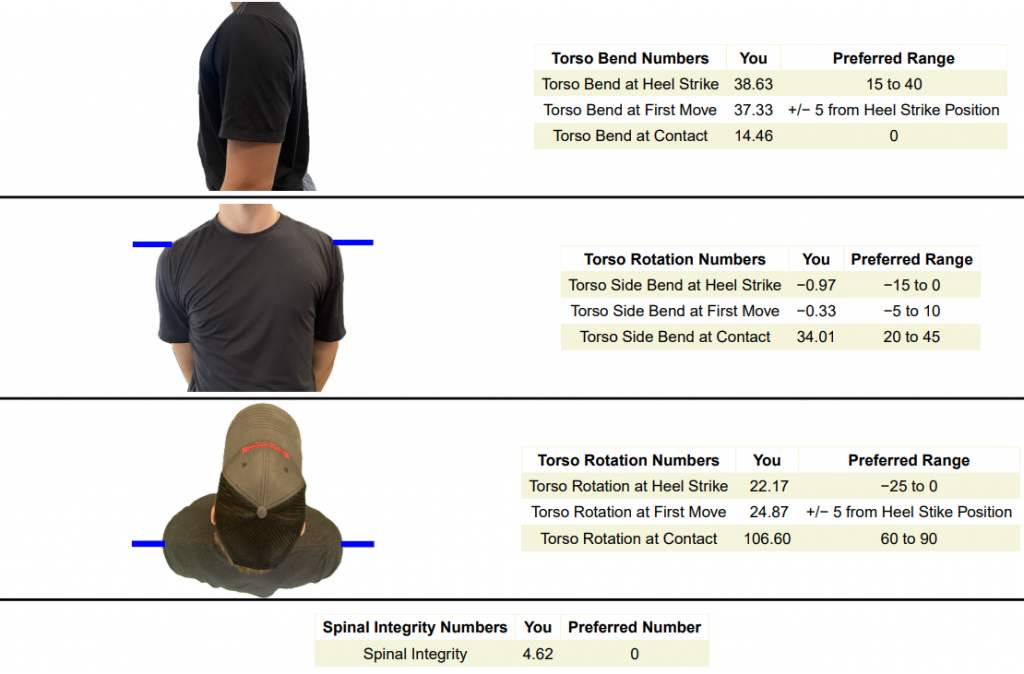
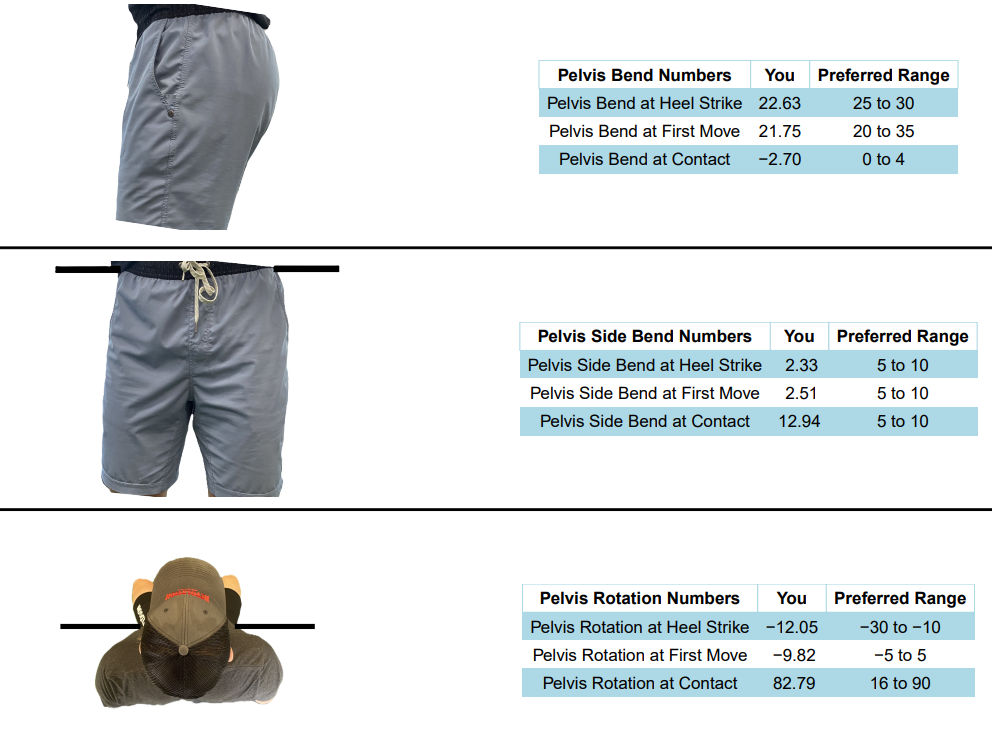
Based on the above charts, we can see that Pete has quality movements, allowing him to get into the proper positions for the majority of what we are looking for. Additionally, upon completing assessments, our hitting director will be able to share reports created by K-Vest, which will look like this:
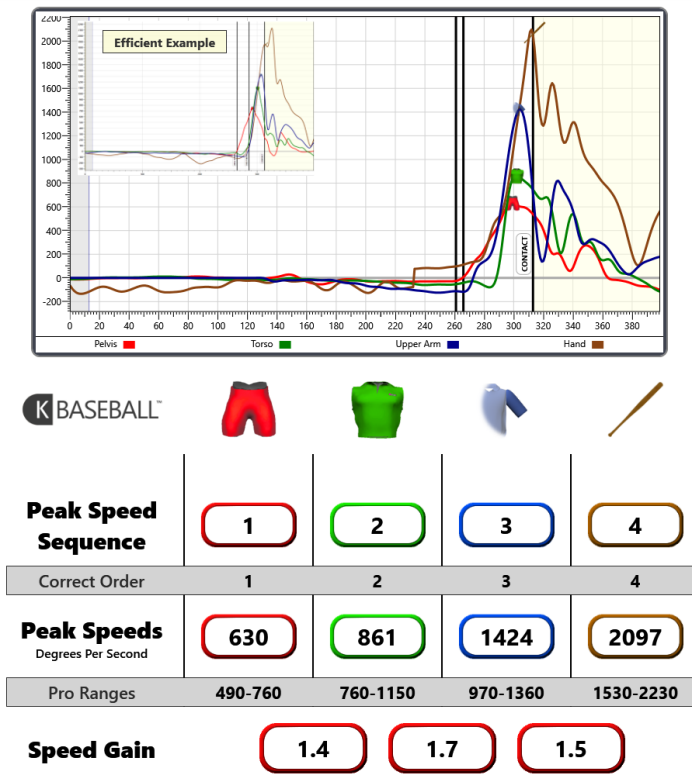
With this detailed report from K-Vest, we see that Pete sequences properly (1→ 2→ 3→ 4), and all of his speeds are within range. Sequencing and gaining speed throughout the swing is imperative to generating efficient power in the swing. Getting as consistent as possible in sequencing allows hitters to maximize their power.
Conclusion
We are very excited to watch Pete Durocher continue his success and eventually move on to play at the next level. Using the tools of Blast Motion, HitTrax, and K-Vest, we get an all-encompassing view of what makes Pete such a good hitter.
For a full copy of the report click here.
Below is a video of a home run from Pete. I hope you enjoyed reading about our new report.
By Kyle Corso (RPP Data Intern, Candidate for Bachelor’s Degree in mathematics-statistics from Columbia University)