In Part 1 of this article, we covered in great depth the optimal metrics for an MLB fastball based on “slugging averages against” during the 2021 season. In Part 2, we are going to cover the optimal axes for:
-
- Curveballs
- Changeups
- Sliders
- Cutters
The green curves on the charts below are based normal distributions derived using statistical analysis. If you would like further information on these charts please refer to Part 1 using the link above.
1. Curveballs
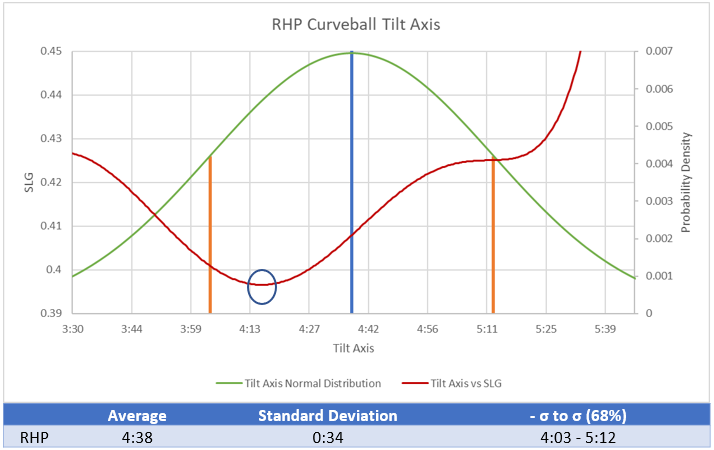
The most optimal tilt axis that generated the lowest avg SLG in the MLB during the 2021 season was around 4:15 (n=187).

2. Changeups
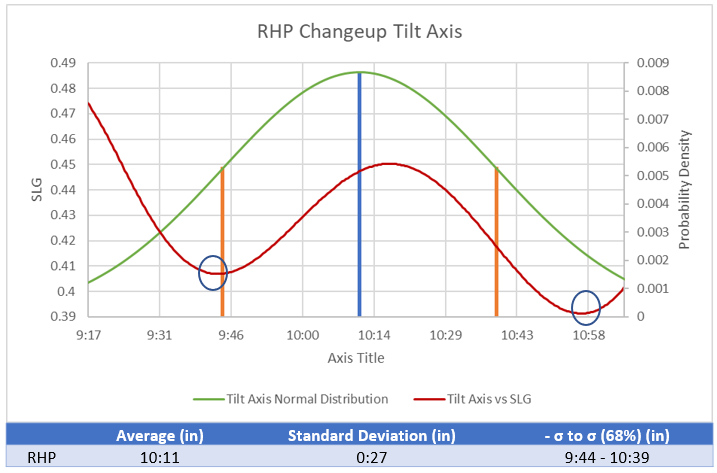
The most optimal tilt axes that generated the lowest avg SLG in the MLB during the 2021 season was around 9:40 and 11:00 (n=266).

3. Sliders
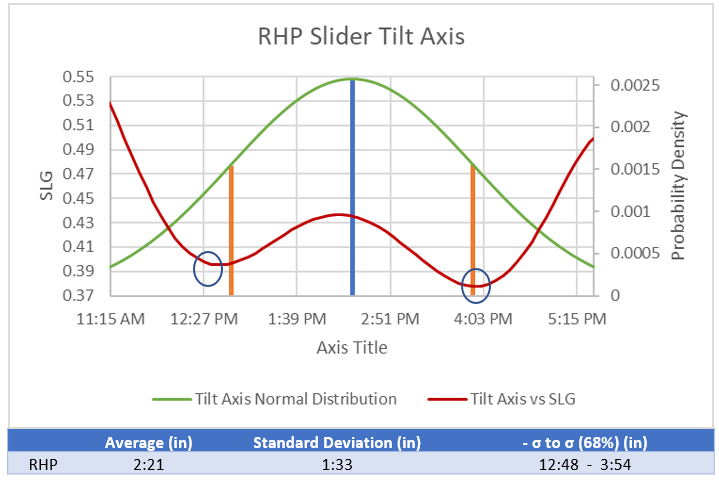
The most optimal tilt axes that generated the lowest avg SLG in the MLB during the 2021 season was around 12:30 and 4:00 (n=365).

4. Cutters
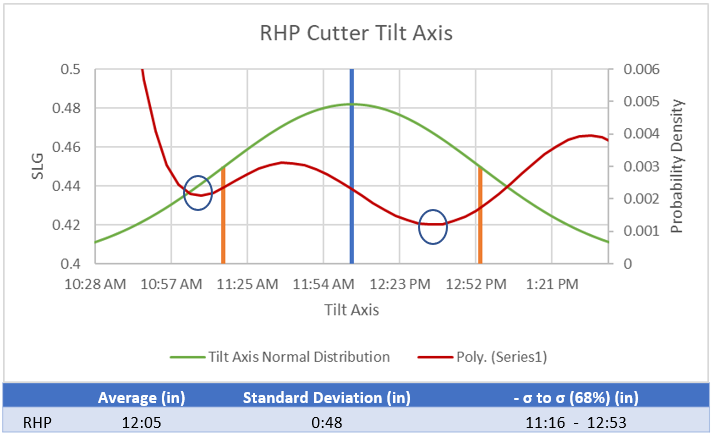
The most optimal tilt axes that generated the lowest avg SLG in the MLB during the 2021 season was around 11:00 and 12:30 (n=122).

By RPP Data Analytics Intern Ken Ruth. He is currently a student at Brigham Young University finishing up his BS degree in computer science. He is also performing data analytics for the BYU Baseball program.
Sources:
Enter your email below to be added to our email list!
