
There is certainly no shortage of data available from MLB for on-field performance by pitchers and players. In this article, we have combined data from several sources, including FanGraphs and Baseball Savant, to help identify the most effective pitch movement patterns in Major League Baseball. More specifically, we analyzed the performance of 4-seam fastballs from major league pitchers during the 2021 season (392 right-handed), by comparing slugging averages against horizontal, vertical movements and tilt axes of fast baseballs.
Although it is usually considered an offensive stat, the slugging average can also be viewed as a measurement of pitcher effectiveness, by evaluating the outcome of a pitcher’s arsenal. By calculating the “slugging formula against” a pitcher, one can tell how often they are allowing hits, and what amount of damage those hits are causing. Here is the basic definition of the “slugging formula”:
(Singles + 2 * Doubles + 3 * Triples + 4 * HRs) / At Bats
By charting the data and using basic statistical normal distribution analysis (please click here for a statistics primer on “normal distribution”), we can observe the most effective vertical and horizontal breaks and tilt axes from a slugging standpoint. The following article reviews:
-
- Vertical Break vs. Slugging Average Against
- Horizontal Break vs. Slugging Average Against
- Tilt Axes vs. Slugging Average Against
- Velocity vs. Slugging Average Against
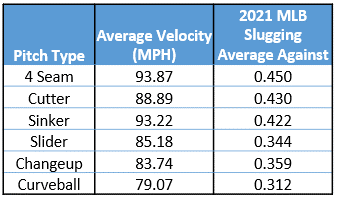
Although we could have selected any type of pitch for this analysis, we selected fastballs as they are the most commonly thrown pitch. Below are the slugging averages by pitch type for MLB pitchers in 2021:
In the sections below, you will see several different charts. Each of these charts has a normal distribution (click here for primer) for fastballs thrown (green curve), with the x-axis representing the either horizontal, vertical movement or tilt axis.
The charts are centered with the average of the x-axis metric at the middle of the graph and 2 Std. Deviations of data on each side of the average. This means that each of the charts includes 95.4% of the data (2*34.1% plus 2*13.6%) for the given metric along the x-axis.
We compare the specific metric along the x-axis with the “Average Slugging Against” fastballs along the y-axis, which is calculated by taking the number of hits that a pitcher gave up in the 2021 season on four-seam fastballs and dividing that by the number of at bats that a pitcher has thrown at least one four-seam fastball. There are some gaps and shortcomings in this data that is available to the general public, but it’s the best we could gather from Baseball Savant.
For illustrative purposes, in the following charts, we will also highlight the values of a few notable major league pitchers including Charlie Morton, Shohei Ohtani, Max Scherzer, Zack Greinke and Yu Darvish.
Note: Before we get into the meat of this article…
-
- It’s important to note that there are many aspects that make a pitcher successful on the mound. There is no single metric that drives overall success.
- All pitch movement data is from a catcher’s perspective.
- Horizontal and vertical movements by themselves only tell a partial story, which may not always yield the most optimal results.
Now, let’s get into it…
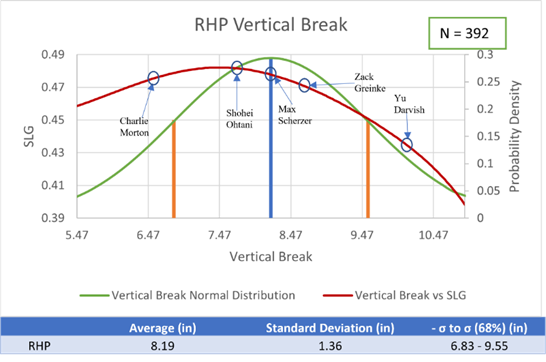
1. Fastball Vertical Break
The chart below summarizes in statistical format the effectiveness of vertical break on Slugging Averages Against.
Green Curve – The green curve represents the normal distribution for all vertical breaks in MLB 2021 season. From our calculations, we determined that the average vertical break for the 392 right-handers from the 2021 season is approximately 8.2 inches, with 68.2% of vertical breaks located between 6.8 and 9.6 inches (1 Std. Deviation on each side of the average, denoted by the orange lines).
Red Curve – The red curve represents the best representation of slugging percentages (along the left y-axis) vs. the vertical movement. An example of a major league pitcher that sits near the average vertical break is Max Scherzer. On the lower end of the amount of vertical break, Charlie Morton and Shohei Ohtani sit with 6.4 and 7.8 inches of vertical break, respectively. Yu Darvish sits at the higher end, with 9.8 inches of vertical break. It appears that generally the higher the vertical break on 4-seam fastballs the lower the slugging average. However, as mentioned earlier breaks along each axis by themselves only tell a partial story.
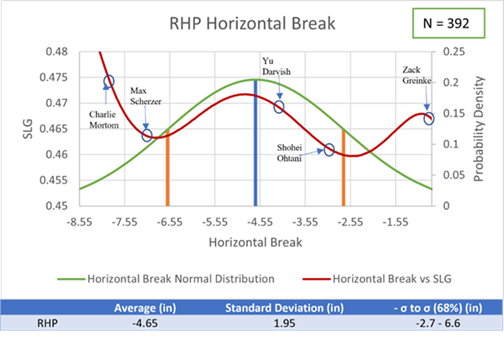
2. Fastball Horizontal Break
The chart below summarizes in statistical format the effectiveness of horizontal breaks on “slugging averages against”.
Green Curve – The green curve represents the normal distribution for all horizontal breaks in MLB 2021 season. From our calculations, we determined that the average horizontal break for the 392 right-handers from the 2021 season is approximately -4.65 inches, with 68.2%, of horizontal breaks located between -2.7 and -6.6 inches (1 STD DEV on each side of the average, denoted by the orange lines).
Red Curve – An example of a major league pitcher that sits near the average horizontal break is Yu Darvish. On the other hand, Shohei Ohtani sits with -2.8 inches of horizontal break and Charlie Morton with nearly -8 inches. It certainly appears that the most optimal horizontal break from a “slugging against average” is at approximately 2.5 inches. Once again, as mentioned earlier breaks along each axis by themselves only tell a partial story.
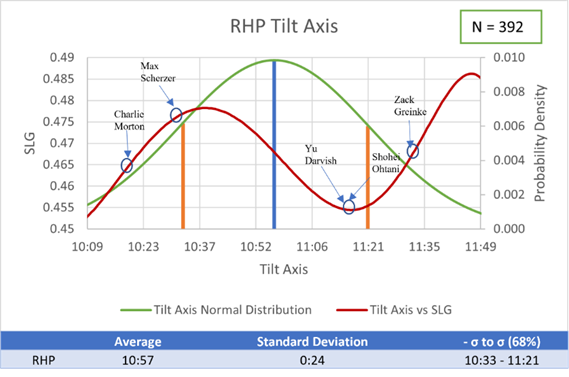
3. Fastball Tilt Axis
The chart below summarizes in statistical format the effectiveness of tilt axis on “slugging averages against”.
Green Curve – The green curve represents the normal distribution for all horizontal breaks in MLB 2021 season. From our calculations, we determined that the average tilt axis for the 392 right-handers from the 2021 season is approximately 10:57, with 68.2%, of the tilt axes located between 10:33 and 11:21 (one standard deviation on each side of the average, denoted by the orange lines).
Red Curve – Unlike vertical movement and horizontal movement by themselves, the tilt axis measurement has aspects of both metrics embedded into the outcome. You can see Yu Darvish and Shohei Ohtani with lower overall slugging averages at the trough of the curve near 11:15.
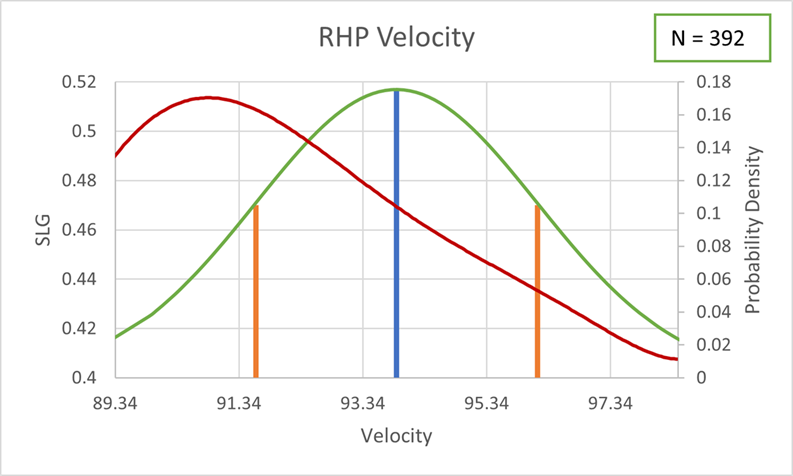
4. Fastball Velocity
It would be difficult to have a conversation about the effectiveness of fastballs without reviewing their velocity. Chart below outlines an average fastball of approximately 93.5 mph, with 68.2% of velocities between 91.6 and 96.1 MPH. The chart speaks for itself, once velo gets passed approximately 90 mph, the higher the velo the lower the slugging average.
Conclusion
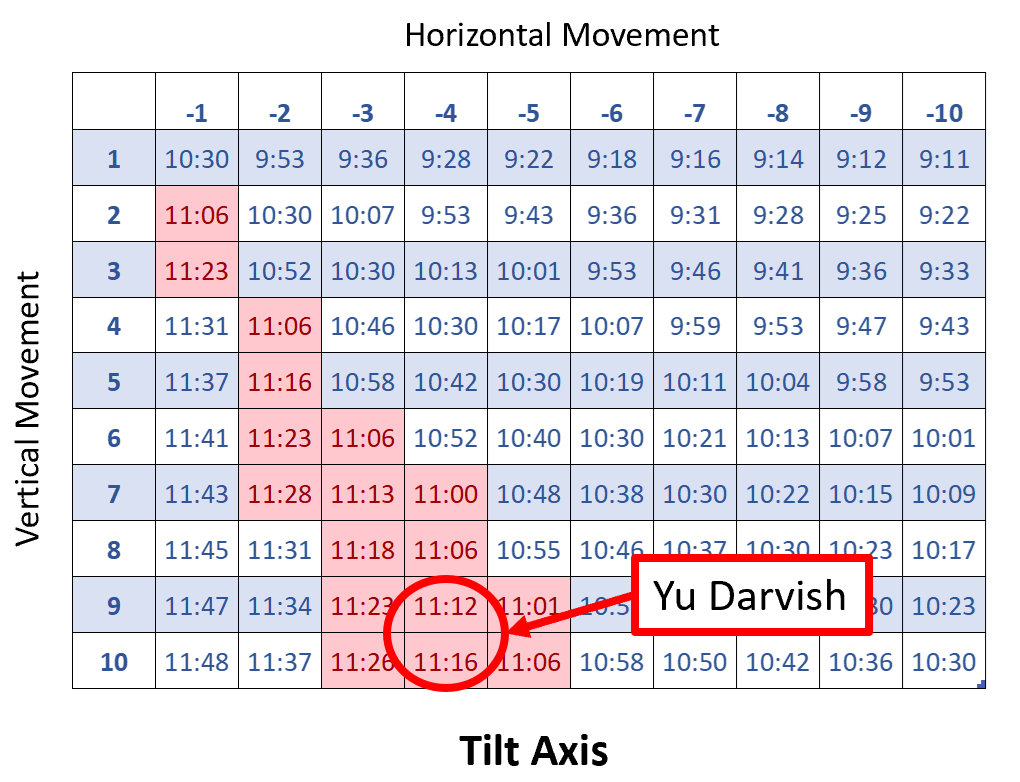
For our conclusions, we calculated the tilt axes from the amount of vertical and horizontal break. One of the most interesting pitchers out of the ones that we listed above in this article is Yu Darvish. His horizontal break is at the higher points of slugging average, while his vertical break is nearly at the lowest. When you look at the tilt axis, which would have effects of both the vertical and horizontal breaks, we see that Yu Darvish has approximately the lowest average SLG.
The following table provides a good summary of our findings, tilt axes generally between 11:00 and 11:30 yield lower Slugging Averages Against.
Click here for Part 2, where we will cover the optimal tilt axes for Curveballs, Change-ups, Sliders and Cutters.
By RPP Data Analytics Intern Ken Ruth. He is currently a student at Brigham Young University finishing up his BS degree in computer science. He is also performing data analytics for the BYU Baseball program.
Sources:
Enter your email below to be added to our email list!