
“Do Pitchers Repeat their Mechanics?” is a question you often hear with strong opinions on both sides. Luckily, we have a motion capture system here at RPP which allows us to measure movement with a high degree of accuracy. And, we have an answer to the question!
Before we get into the specifics, we would like to cover two related topics, the motion capture system (“mocap”), and a brief primer on normal distributions and standard deviations.
Motion Capture System
To understand the scope of this project, it is important to understand the source of the information.
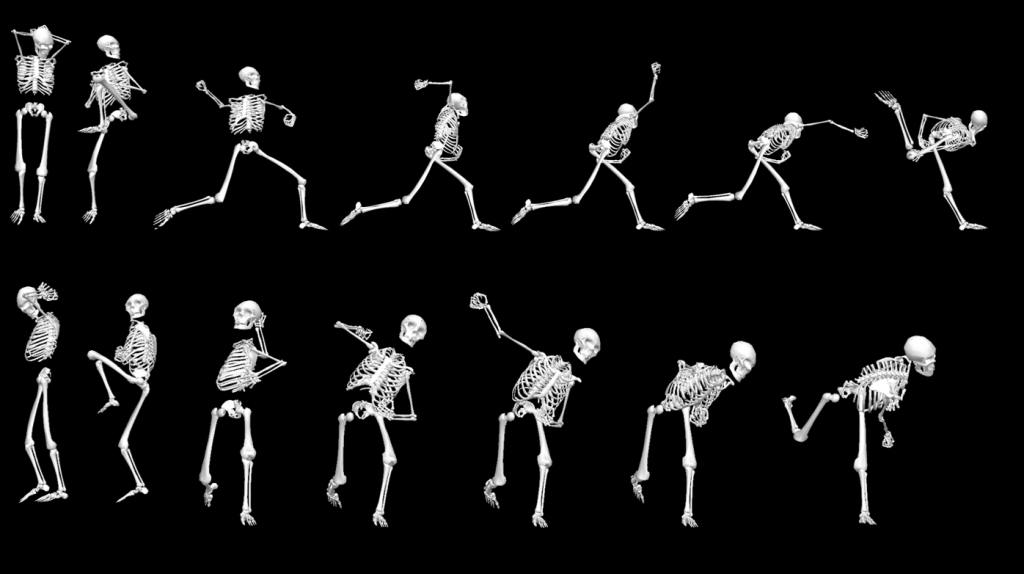
Mocap is the process of digitally recording movement. It is used in military, entertainment, sports, and many other applications. It basically refers to recording human movement digitally and using that information to create a digital avatar at extremely high levels of accuracy. Consequently, mocap is considered to be the gold standard of measuring human movement.
The process of recording a mocap entails placing reflective markers on the athlete which allow optical cameras to track the athlete’s movement through space. Marker movements are recorded synchronously with multiple cameras at the same time and many times per second to isolate each marker and record the correct movements down to a 3-5mm accuracy level.
This information is then mapped to a digital 3D model so that a computer-generated avatar can replicate the same actions as the athlete in the digital world. Since the avatar is digital, the movement can be viewed from any angle at any given time.
RPP’s Qualisys Mocap includes a 10-camera system which tracks 48 markers attached to the athlete during the pitching delivery. From this, we can pull specific metrics of certain angles that the body is positioned in throughout the pitching delivery. These metrics are the basis of determining whether pitching mechanics are repeatable.
Normal Distributions and Standard Deviation
In statistics, a “normal distribution” is a type of continuous probability distribution graph given a set of data points. You can call it a bell curve if you choose, and it summarizes in chart-from the likelihood of outcomes given the specific dataset.

The x-axis represents measurements of standard deviation from the average result (center of the bell curve). This is considered a “zero” standard deviation. In laymen’s terms, the more narrow the peak of the bell curve the less the variability in the data. On the other hand, the flatter the bell curve the higher the variability in the data set.
If interested, here is a link to a brief write-up on normal distributions and standard deviations.
Do Pitchers Repeat their Mechanics?
For this study, we analyzed 18 different metrics that we review often from our motion capture database from the assessments of 116 different pitchers; 70 of whom throw in between the 70-80 MPH range and 46 who throw 85+ MPH.
We split the data into 2 different groups to evaluate whether velocity has an impact on pitching mechanics variability among pitchers. The age group in both data sets is 16 and older. These 18 metrics are further broken down by their anatomical groupings (Shoulder/Arm, Trunk, Lower Half).
85+ mph Velocity Group
The following table provides the median result and the corresponding median standard deviation (SD) for each metric.
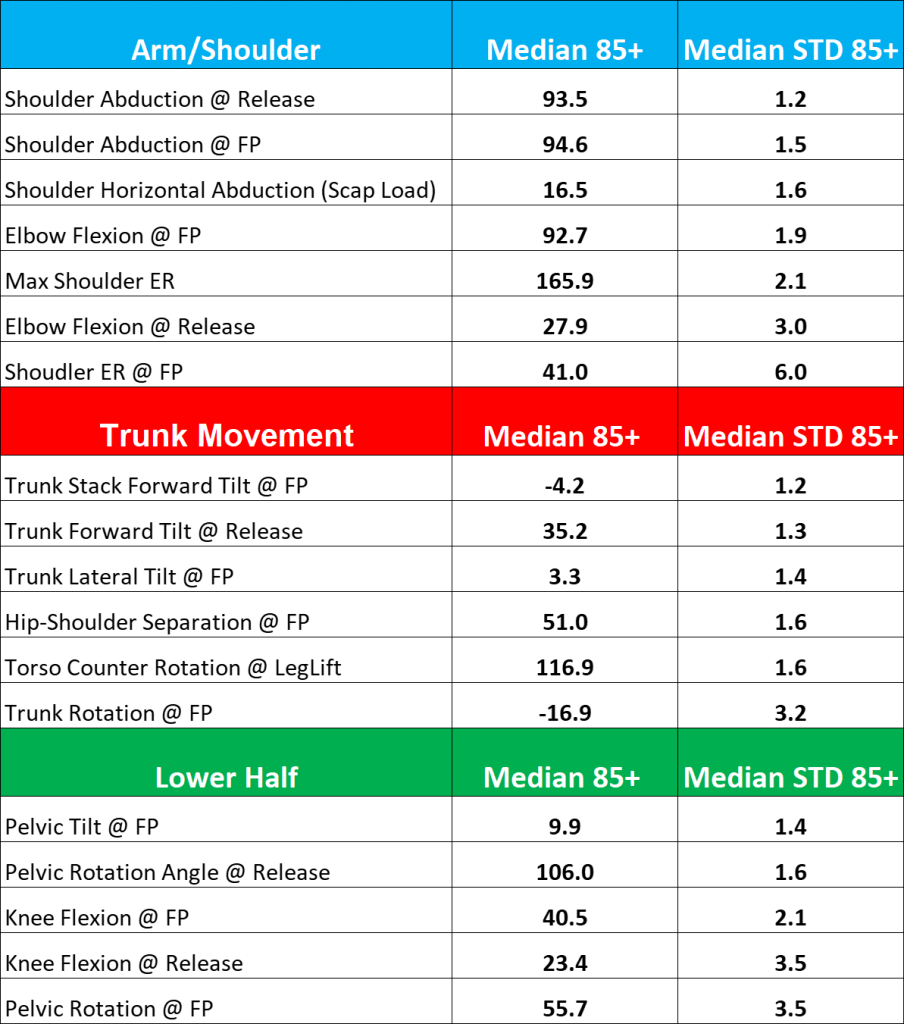
It is important to note that every pitcher is different, and their metrics may widely vary from one another. The question is to what degree each pitcher can keep their own variability from pitch to pitch.
As a result, the median SD figures (on the right side of the table) is the more relevant number in this table because it specifically highlights the variability of the metric against the average number. For example, let’s look at the first metric above, Shoulder Abduction @ Release.

You can see that average Shoulder Abduction @ Release is 93.5 degrees, while the standard deviation is 1.2 degrees. This means that nearly 70% of the pitchers in the group had a Shoulder Abduction @ Release metric between, 92.3 and 94.7 degrees. You can also think of it as 1.2-degree variation against 93.5-degree average number. This is not considered much variability.
Most of the metrics above are only within a few degrees of the average figures. There also does not appear to be a significant difference in the SDs observed in the Lower Half, Shoulder/Arm or Trunk groups. There is only one metric with a significantly higher SD than the rest, Shoulder External Rotation at Foot Plant which has a SD over 6 (12-degree range of variability).
70-80 mph Velocity Group
Now let’s look at the 70-80 MPH group to see if there are any notable differences. You can see that the median standard in the second group also tend to be on the low side.
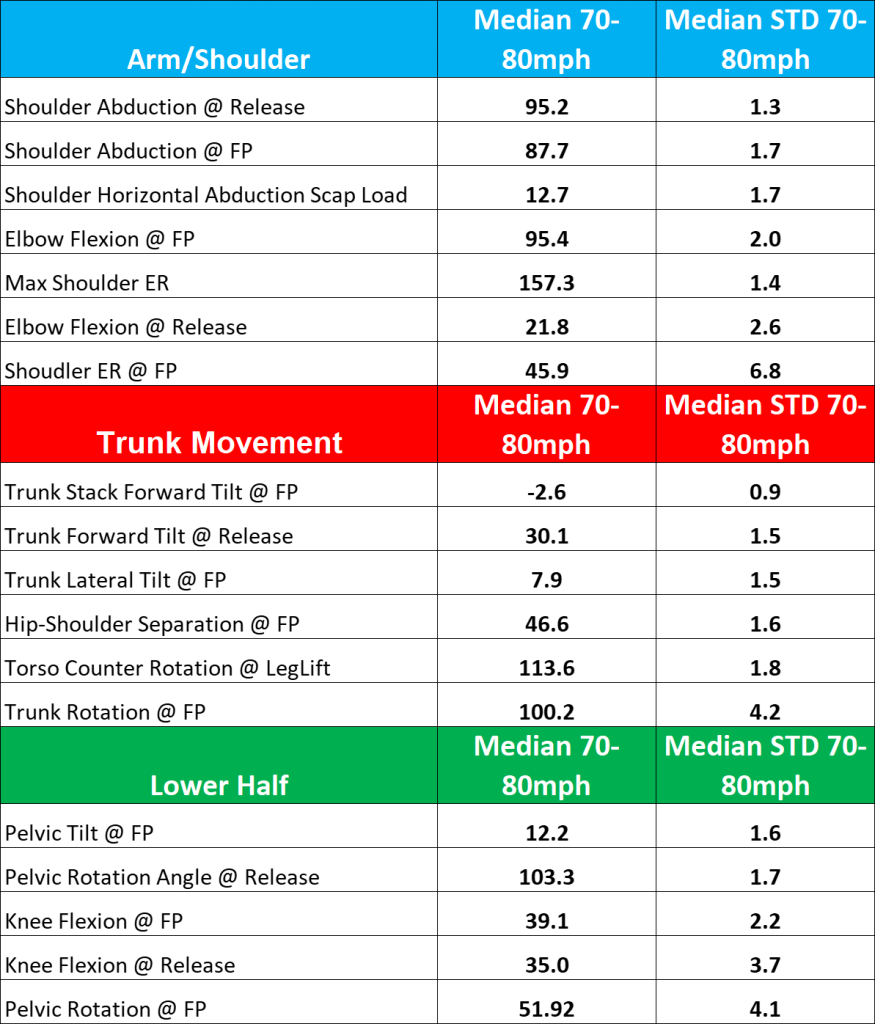
Comparing 70-80 and 85+ mph
When comparing the two velocity groups we can see that the median angle can vary between a few degrees. However, the variations are still quite low regardless of velocity. As we can see from the two charts, the 70-80 mph is very similar to their harder throwing counterparts at 85+ mph. The following chart is a side-by-side comparison of the SDs between the two velocity groups.
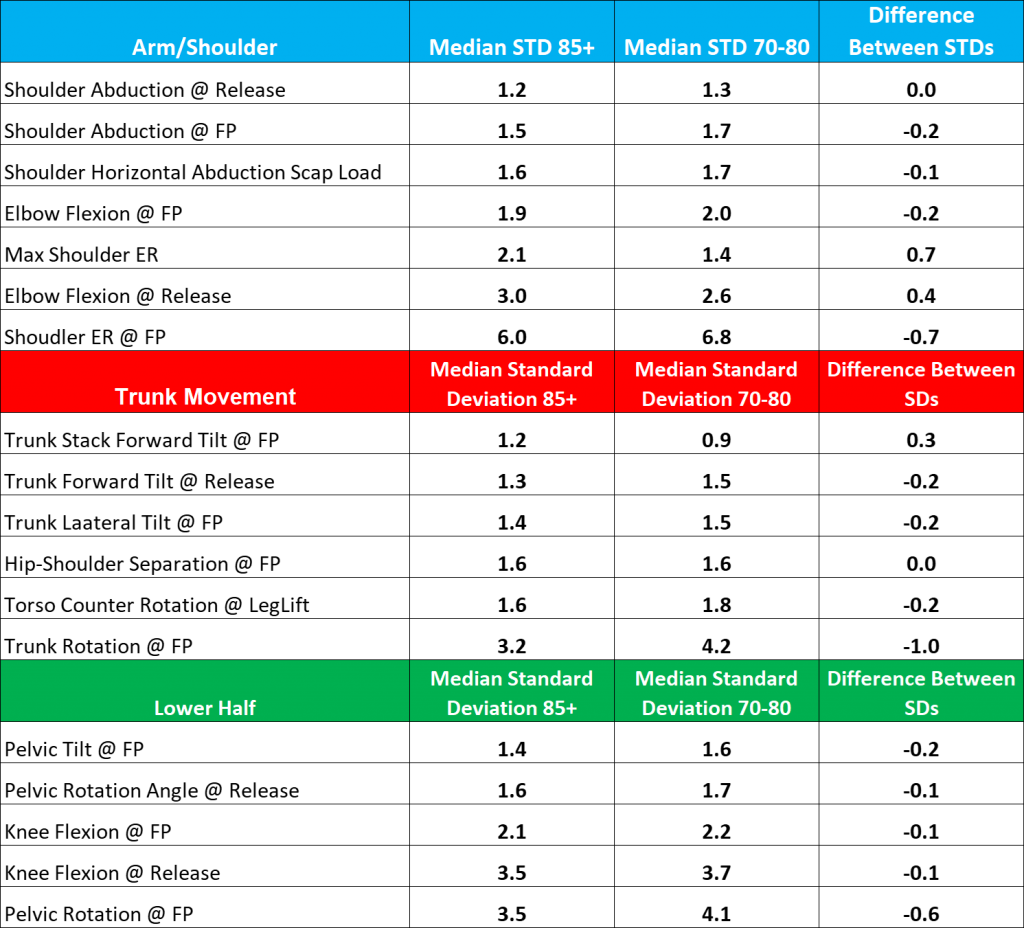
You can see that most of these pitchers repeat their mechanics with minimal variation with some ranges being less than 2 degrees. There are few metrics with a range greater than 5 degrees and shoulder external rotation at foot plant remains the greatest outlier. When directly comparing the two we see that the difference in standard deviations is rarely larger than half a degree. No particular metric jumps out as being vastly different.
Conclusion
We can conclude that pitchers who have been evaluated by our motion capture system repeat their mechanics with relative success. Further, given the variation in pitchers and the accuracy of the motion capture system, we can conclude that pitchers in general repeat their mechanics pretty well.
The body and the brain are amazing things!
By RPP Data Analytics Intern Sean Curvan. He is currently a student at Binghamton University pursuing a Bachelor of Science degree in Business Administration, Concentrations in Finance.
Enter your email below to be added to our email list!