
A few years ago, we installed HitTrax for our hitting program. Combining HitTrax batted ball results with Blast Motion sensors provides excellent pre- and post-contact information on batted balls. Now in this 2 part article, we’re going to review what pre-contact metrics from Blast Motion and post-contact data from HitTrax tell us about a hitter and his aptitudes:
-
- Part 1: Pre-contact data provided by Blast Motion
- Part2: Post-contact data from HitTrax
Blast Motion
To be blunt, we are big fans of the Blast sensor and we’ve written several articles on it in the past. If you’d like to read some basic information on its swing metrics please click here.
The chart below summarizes an athlete’s blast data versus suggested ranges by level as provided by Blast from their national database.
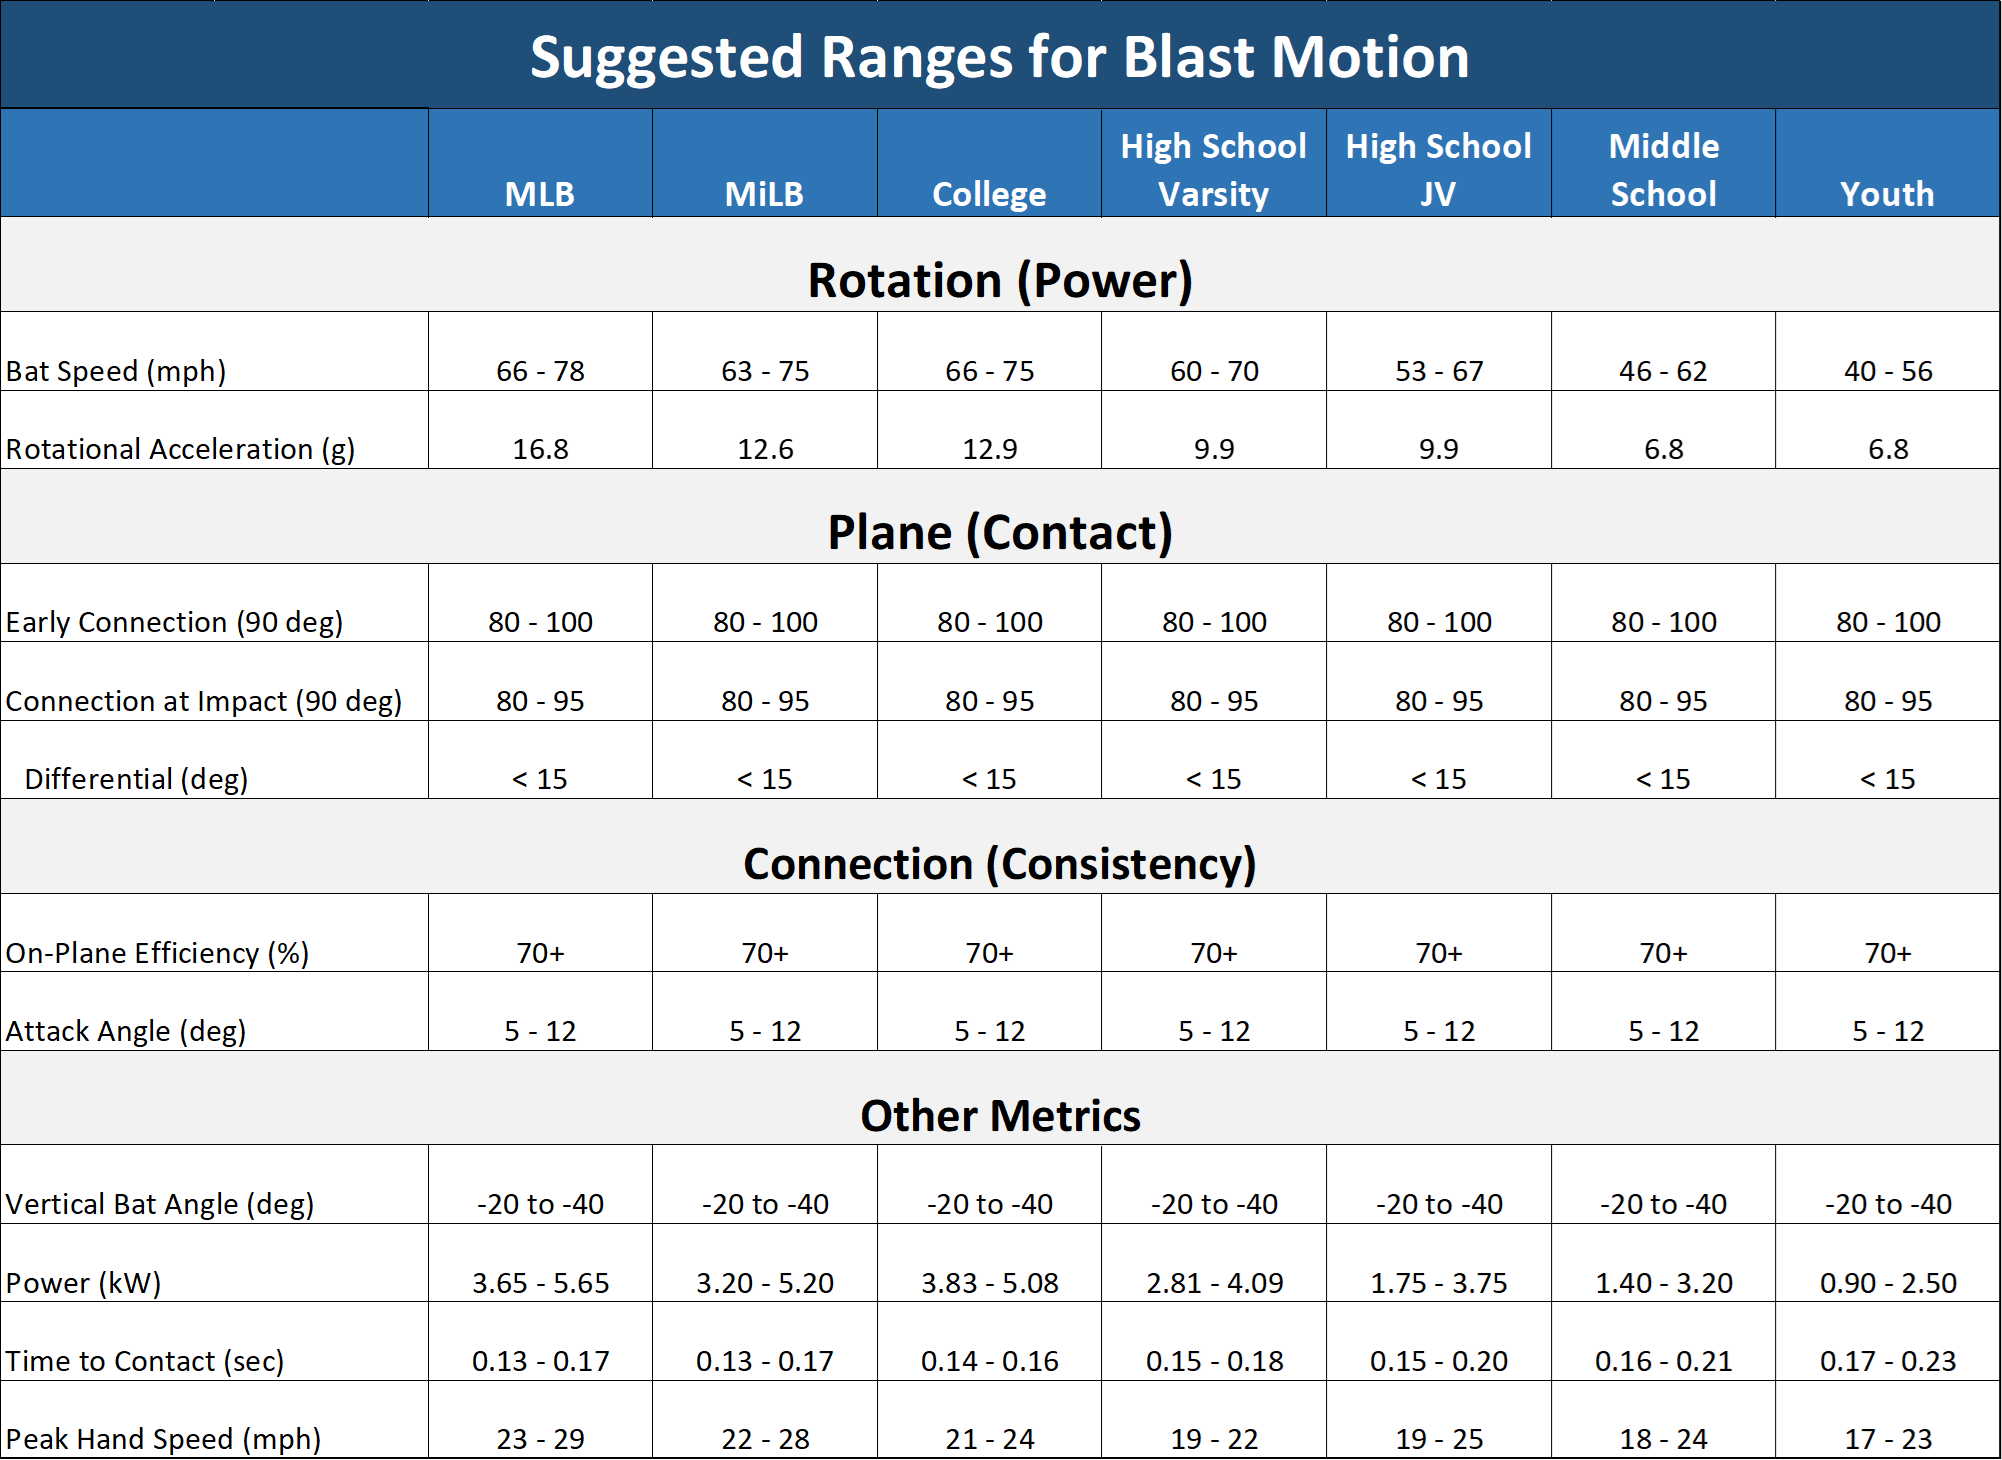
This information is a great starting point, but there is more to what the underlying data can tell us. We have to go beyond the averages and single swings, and dig deeper with some basic statistical analysis to discover it. Blast Motion segments their information into 3 main categories:
-
- Rotation (Power)
- Plane (Contact)
- Connection (Consistency)
Let’s review each segment and see what we’re missing when we only look at single swings or averages.
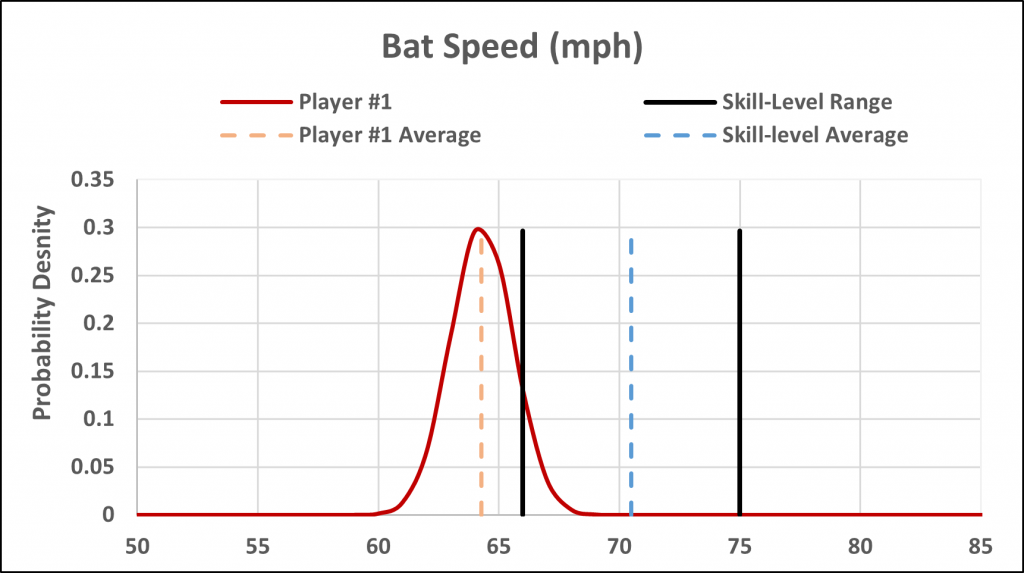
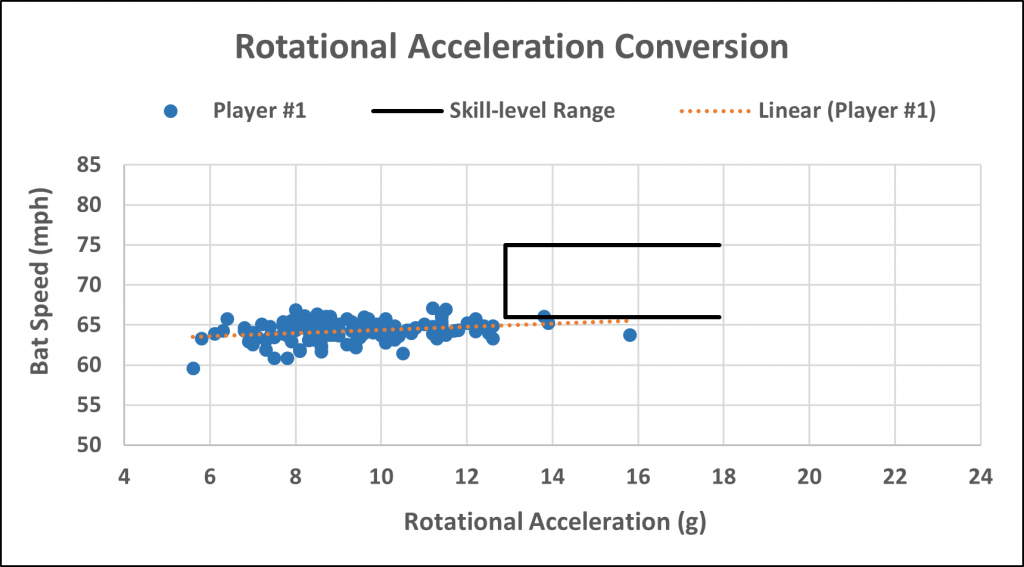
Rotation (Power) – The charts below provide a summary of bat speed, rotational acceleration (RA) and what we refer to as your RA conversion.
This specific athlete has an average bat speed of 64 mph after 125 swings of BP (orange dashed line), and his skill-level range as outlined by Blast is 66 – 75 mph (black lines). With any given swing, he has a 30% chance (y-axis probability density) of swinging the bat at his average speed.
At first glance you may conclude that his average isn’t too far from the range. But, if you take a closer look on a normal distribution you can see that a large number of his swings actually fall below the suggested range (the area to the left of the black line at 66 mph).
The normal distribution chart basically tells you that simply being near the suggested range is not optimal. For a large number of your swings to fall within the range you clearly want to be at the midpoint (dashed blue line) or higher.
Now, let’s look at his Rotational Acceleration. His average RA is 9.4 (g) versus an average level of 12.9 (g) for his level. He only achieves that level of RA approximately 22% of the time. Take a look at the purple bell curve and see how often his swing is not only below the average level, but way below it.
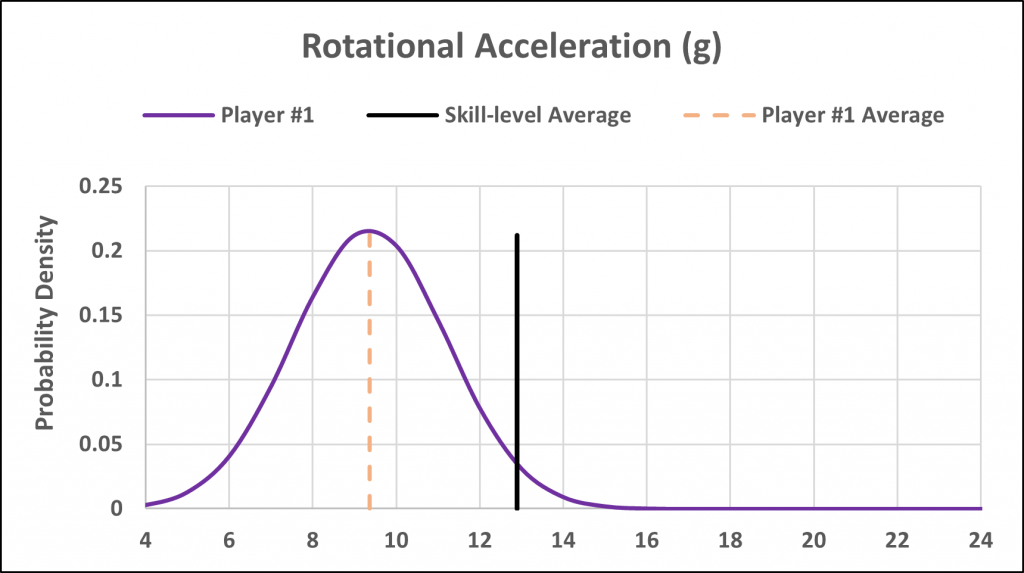
The final take-away is what we call the RA conversion, which is basically evaluating how well your RA is converting into your bat speed at contact. Look at how few swings are even close to this player’s skill-level target range (black lines).
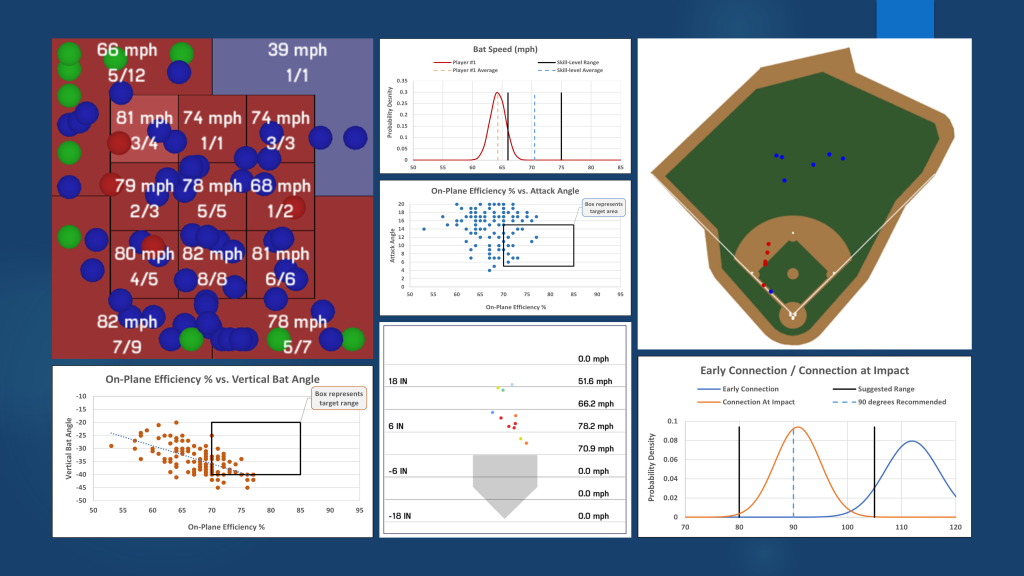
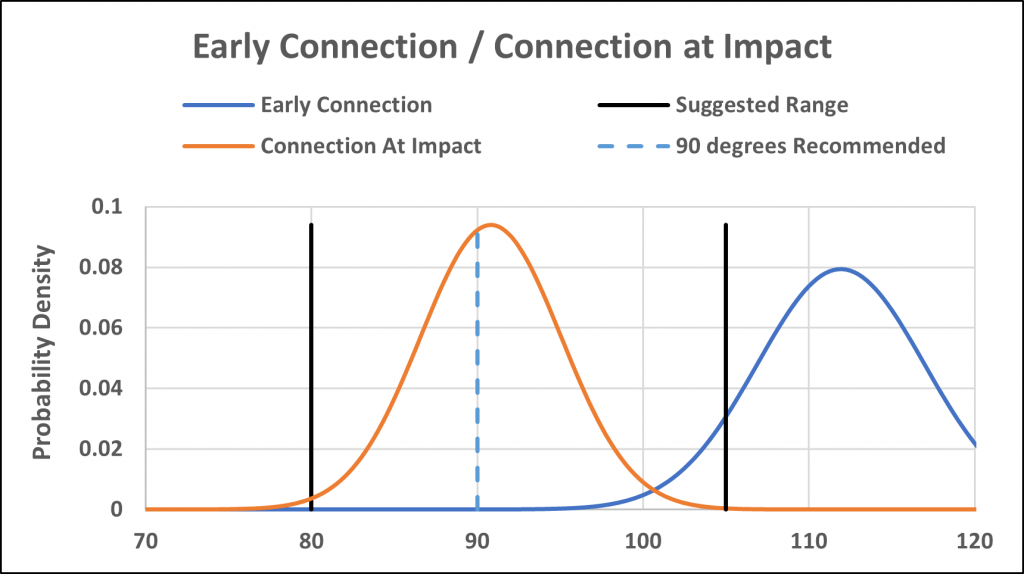
Plane (Contact) – The charts below provide a summary of the athlete’s early connection and connection at impact. According to Blast, the desired range is 80 – 105 degrees for both metrics, with a difference of no larger than 15 degrees between the two. Their general premise is that the closer the two the more consistent your swing.
The average net connection for this athlete is over 20 degrees, definitely a bit high. You would generally want these bell curves (below) to somewhat converge. The more they converge the smoother your swing and the higher your on-plane efficiency %. The farther apart they are, the larger the net difference. In this case, look at the small amount overlap at near 100 degrees of the two bell curves. According to Blast, this can lead to lower on-plane efficiency %s and more inconsistent results.
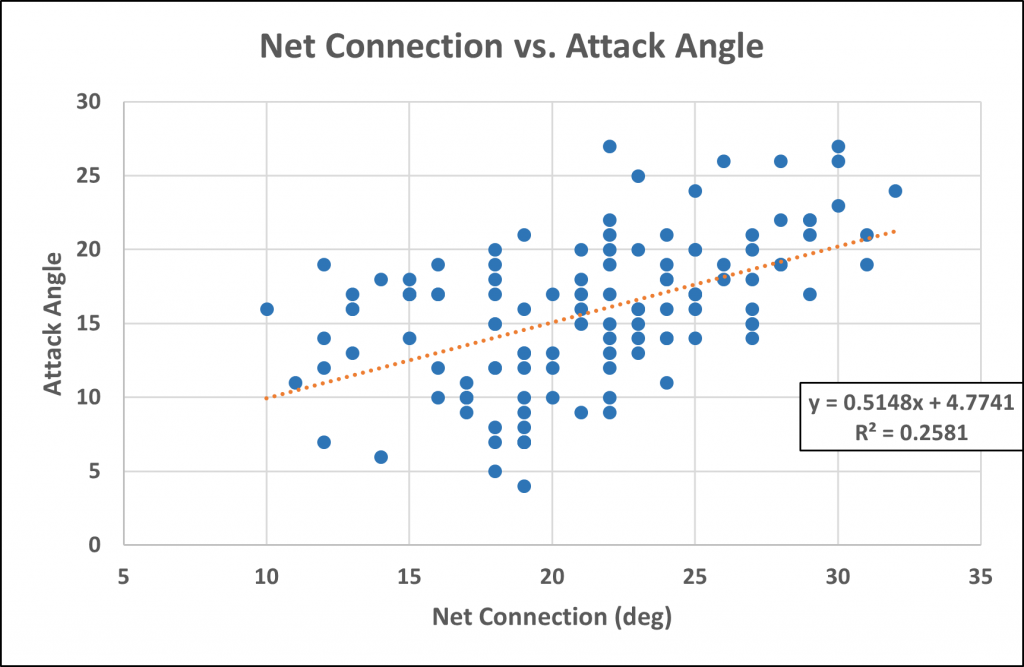
As a side note we have observed a correlation between an increasing “net connection” amount and a corresponding increase in attack angle. Although we can’t explain this at this time, it’s possible that if your AA is too high, it might be that your “net connection” is the culprit. In this case it certainly appears to be.
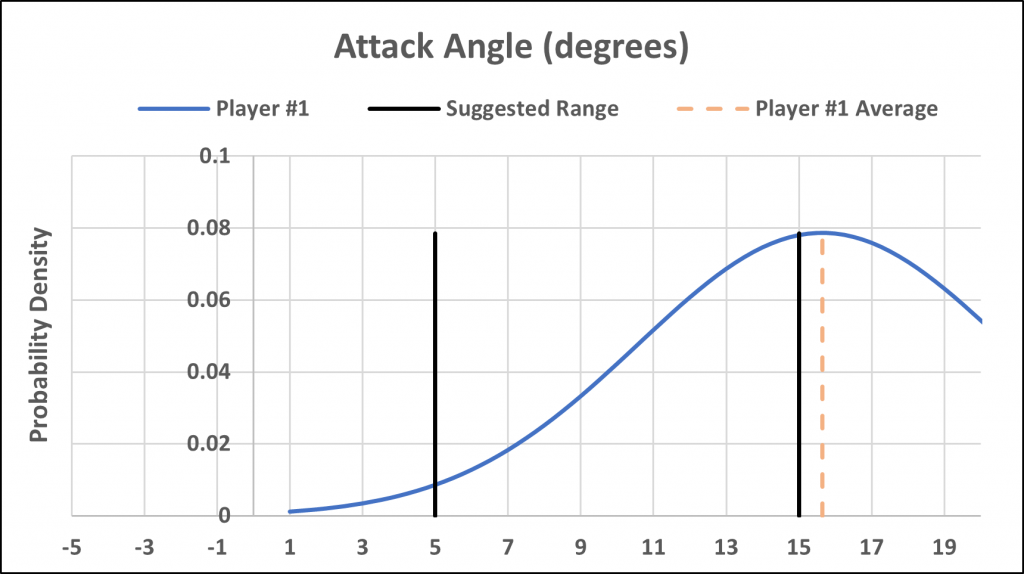
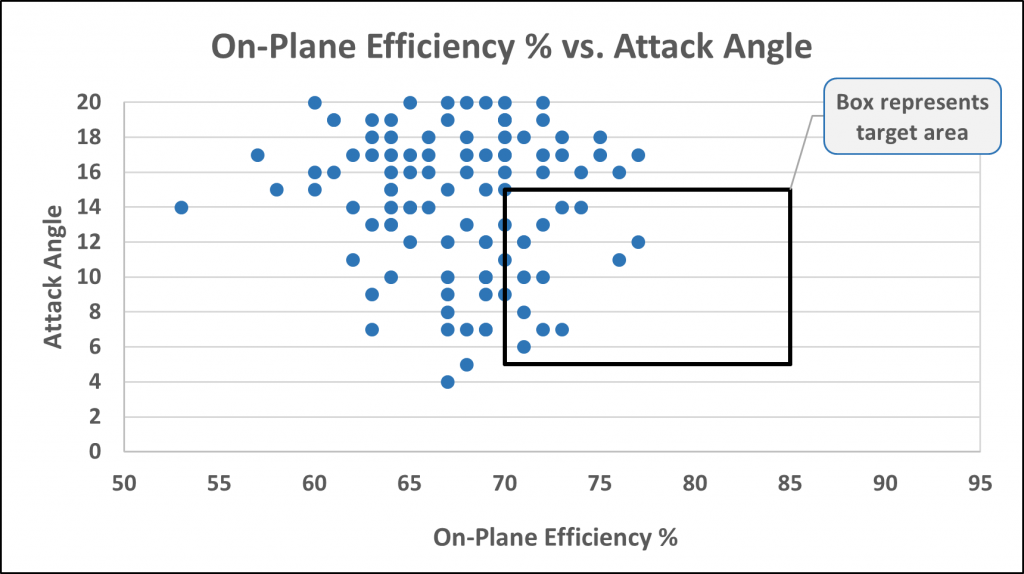
Connection (Consistency) – The Blast Connection Score consists of the Attack Angle and On-Plane Efficiency %. As you can see from the chart below, this player’s average Attack Angle is near the upper end of the suggested range (dashed orange line), which might seem alright if you’re only focused on averages. But, a closer look of his normal distribution shows that more than half his swings are above the suggested range.
Now, let’s look at his AA vs. his On-Plane Efficiency %. His average AA is 16 degrees and his OPE% is 67%, just below the suggested range. But look what happens when you chart them against each other. This athlete basically lives outside the suggested box.
Conclusions
Blast is a great tool. It’s amazing how much one little sensor can tell us about our swing. Full stop! However, you can extract a lot more valuable information from the sensor by examining the data through a statistical lens. In a game of limitless variables, the distributions and correlations of the data is where the answers likely lie.
We all know that hitting is a series of interconnected events. You miss one metric, perhaps no big deal, miss two or more, and soon the misses can cascade on each other and performance at the plate will begin to suffer.
Beginning this off-season, all of our hitters will be equipped with Blast sensors and their data will be evaluated using much of the above analyses. Stay tuned for part 2 of this series on what HitTrax post-contact data can tell you about a hitter.
You live too far to train with us in-house at RPP? You can now train with us on a REMOTE basis.

You can also reach us through our various platforms or simply click below to schedule a phone call.

If you’re interested in receiving our blogs, please enter your email address below!