
In part 2 of this series, we’re going to zero in on HitTrax results (click here for Part 1 on Blast metrics). HitTrax provides a plethora of data in a variety of formats on batted balls that can help us evaluate a hitter’s performance at the plate, including spray charts, depth of contact and strike zone information. Given the amount of variability in hitting a baseball, we generally like to collect information on at least 100 batted balls per hitter. Hopefully this will include incoming pitches throughout the zone with different pitch descent angles to replicate as many different situations as possible.
There are generally two benefits that come with HitTrax. First, are obviously all the areas a player could improve. Equally important is for players to understand their strengths and weaknesses at the plate, so they could make more informed decisions and be better prepared going into competition.
HitTrax provides many excellent visuals for viewing and training purposes. However, throughout this article, you will notice areas where we have supplemented these with our own visuals so that they can be more easily manipulated for assessment and training purposes.
Now, let’s review some of the basics and the ways HitTrax helps us evaluate our hitters.
-
- Basic Metrics
- Spray Charts
- Depth of Contact
- Strike Zone
Basic Metrics
Exit Velocity (EV) is possibly the single most important metric for any hitter. It measures how fast the ball is coming off the bat, and generally the harder the better. When evaluating a player’s EV, the environment and setup should be taken into account. For example, if the batting practice setup is predictable (front toss or even simple BP), the average EV should be higher for the individual than when he is being challenged with more difficult machine rounds or mix rounds.
Exit Velocity – There are two ways to evaluate EV to assess a player:
Peak EV is the hardest hit ball that the athlete achieves in a session. This is a good indicator of raw power and ability to hit the baseball hard without regards to the ball’s trajectory. Basically, it represents the player’s potential at any given time.
Average EV is a great way to evaluate how consistently the athlete hits the ball hard. Ideally, the average should be as close to the peak EV as possible. If, for example, a hitter has a peak velocity of 95mph, but an average exit velocity of 80mph, this would indicate an athlete that has a lot of mishits and weak contact, despite possessing the ability to hit the ball hard.
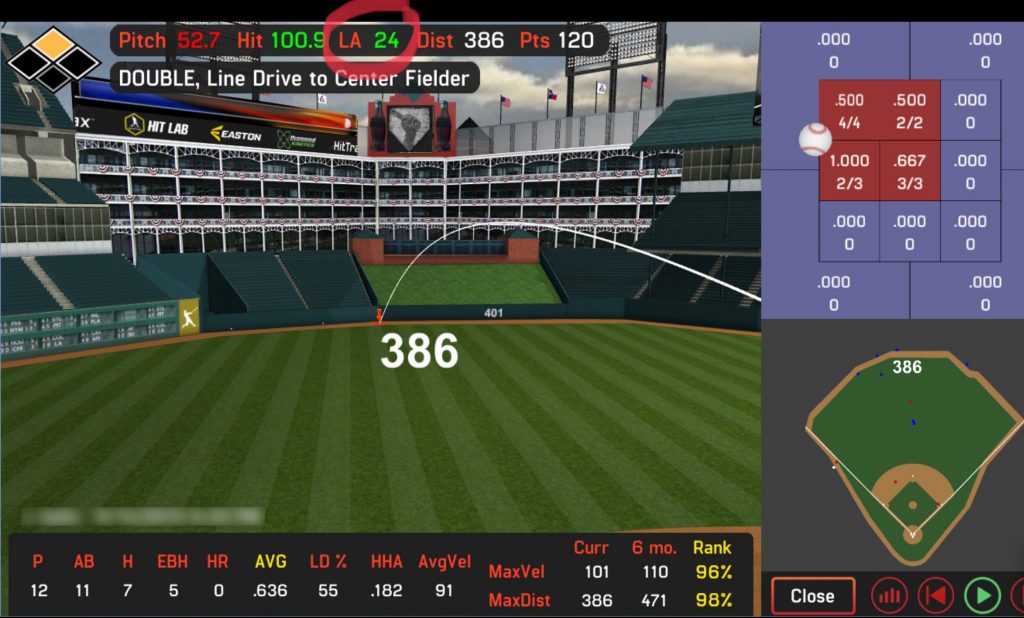
Launch Angle (LA) – While launch angle is essentially a by-product of the swing, bat path, and timing, it is an important metric to consider when evaluating batted ball productivity. An athlete may be able to hit the ball very hard, but we want to be sure that the athlete is hitting the ball at optimal trajectories to maximize production, this is generally somewhere between 10-25 degrees depending on the player’s bat speed.
For example, an athlete may hit the ball hard (let’s say 90-100mph with relative consistency), but if the launch angle for batted balls within this velo range is low (-5 to 5 degrees), the hitter is essentially hitting a lot of ground balls. Now, while these balls have a higher tendency to get through the infield for base hits because of the high exit velocity, this athlete is not maximizing their power potential.
Furthermore, we would want to evaluate what happens when the hitter climbs into higher launch angle windows. If this particular hitter maintains the ability to hit the baseball hard at more optimal trajectories (10-30 degrees), then the work in the cage would focus on achieving more hard hits in this “sweet spot” range. However, if the hitter does not have the ability to maintain their exit velocities in an ideal LA range, then we would work to make an adjustment in the hitter’s movement patterns or swing plane in order to capitalize on their HHBs by producing more line drives.
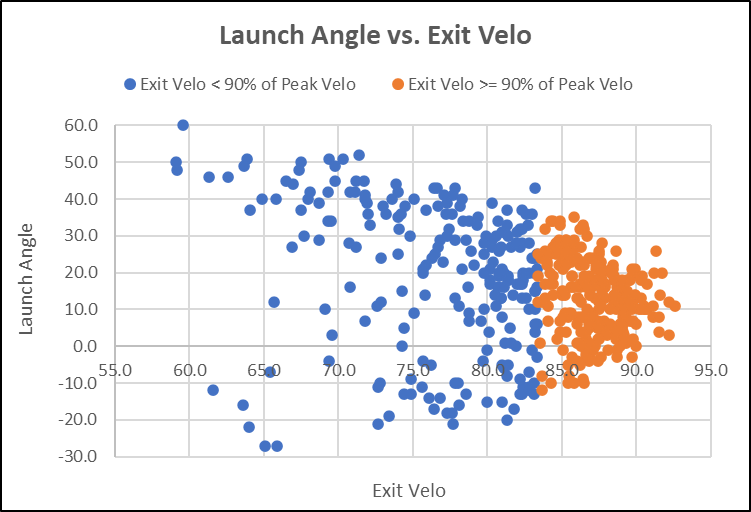
Hard Hit Balls (HHBs) – HitTrax recognizes hard hit balls as any ball within 90% of the player’s peak EV. So, if a player’s peak EV is 100mph, any ball hit 90mph or harder would be considered a HHB. We have found this criterion reliable; however, it is important to note that balls hit slightly under the HHB threshold on HitTrax can still produce positive outcomes on batted balls with line drive trajectory (with LA around 10-20 degrees for EVs between 80-90mph, and about 15-25 degrees for lower velocities in the 70-80mph range); these are batted balls that are likely to fall in front of or between outfielders.
In addition, we also review consistency of HHBs to evaluate how often the player makes hard contact. It represents the % of time the player exceeds 90% of EV during a session.
Here is a chart that puts it all together. EV vs. LA with blue color representing hits below 90% of Peak EV and orange color representing EV above or equal to 90% of peak values. As you can see there is an optimal LA range where players hit the ball hardest.
Spray Chart
Spray charts are a great tool to evaluate a player’s ability to produce quality batted balls to all parts of the field:
-
- Pull side
- Middle
- Oppo
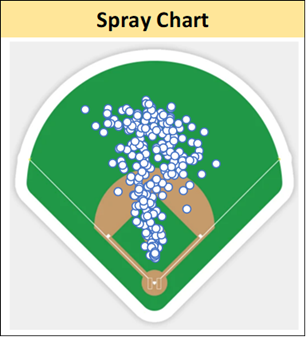
While the ideal spray chart would have an even balance between balls hit to the left side of the field, center, and right, this is typically not the case, even with hitters at the highest level. Look at any big leaguer’s spray chart, notably on home runs or extra base hits, and you’ll see that most guys have a “tunnel” where they hit the ball the hardest and achieve higher slugging numbers.
Nonetheless, we want to see an ability in our hitters to drive the ball efficiently to all fields. So, while a hitter’s peak EV may be on a ball hit to the pull side, and a majority of their batted balls are to the middle of the field, we want to see the hitter demonstrate the ability to produce hard hit balls (within 90% of peak EV) with good trajectory (10-25 degrees) to the opposite field as well. If they are not capable of doing this within a session, this is an indicator that the hitter will likely need to make some swing improvements to maximize productivity to all fields.
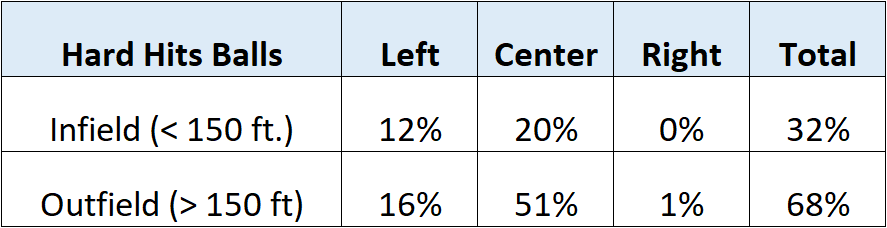
We also look at combining spray charts with HHBs to get a better understanding of player tendencies.
Depth of Contact
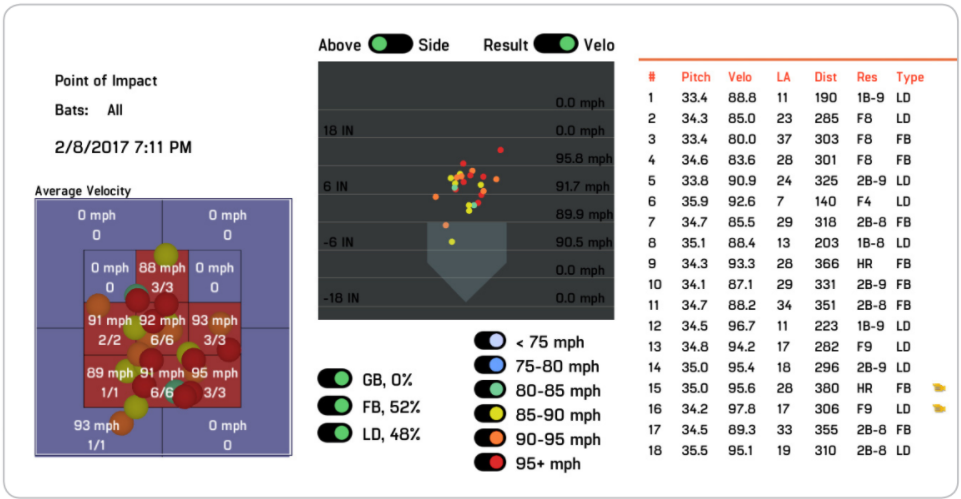
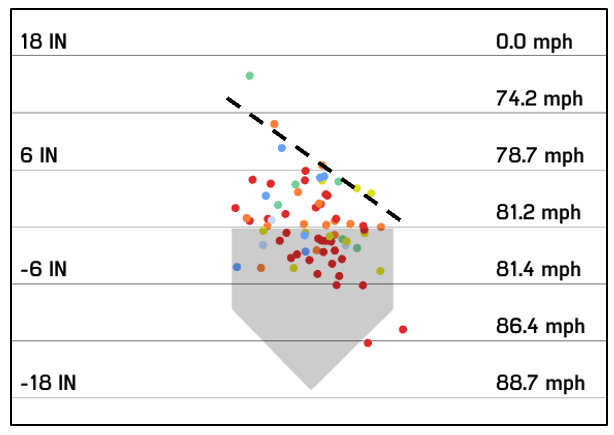
Evaluating depth of contact is a great way to review whether hitters are differentiating between incoming pitches. It also reveals the window of timing an individual hitter has to impact the baseball. With the hitters we have had in our facility, we have found that a depth window of about 14-18 inches is ideal; generally speaking, balls on the inner third should be contacted more out front, balls in the middle of the plate a bit deeper, and pitches on the outer third even deeper. A hitter with good on-plane efficiency will typically have a slight angle in their window of impact (visual below with dotted black line) and display a range of depth on hard hit balls .
If the athlete possesses a smaller window of contact (let’s say 8-10 inches), then they have less room for adjustability, a smaller opportunity to achieve flush contact, and ultimately, less plate coverage.
Strike Zone
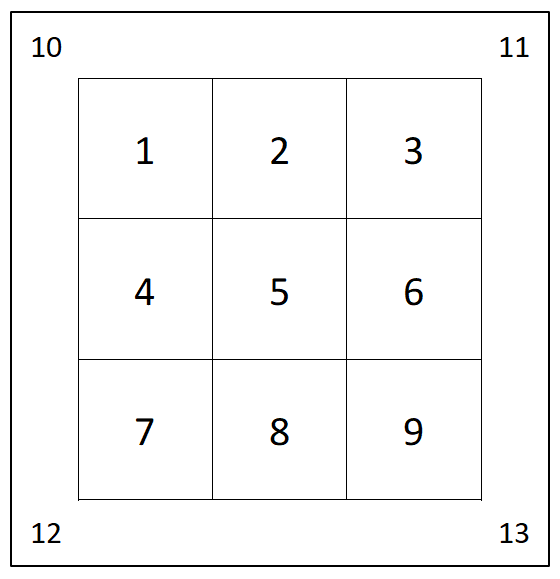
Strike zone contact information helps us look at a variety of player information and tendencies, from exit velo to swing decisions. It also helps point out a hitter’s strengths and weaknesses throughout the zone. HitTrax data breaks up the strike zone into 13 sections, 9 inside the zone and the 4 areas outside the corners / edges as follows:
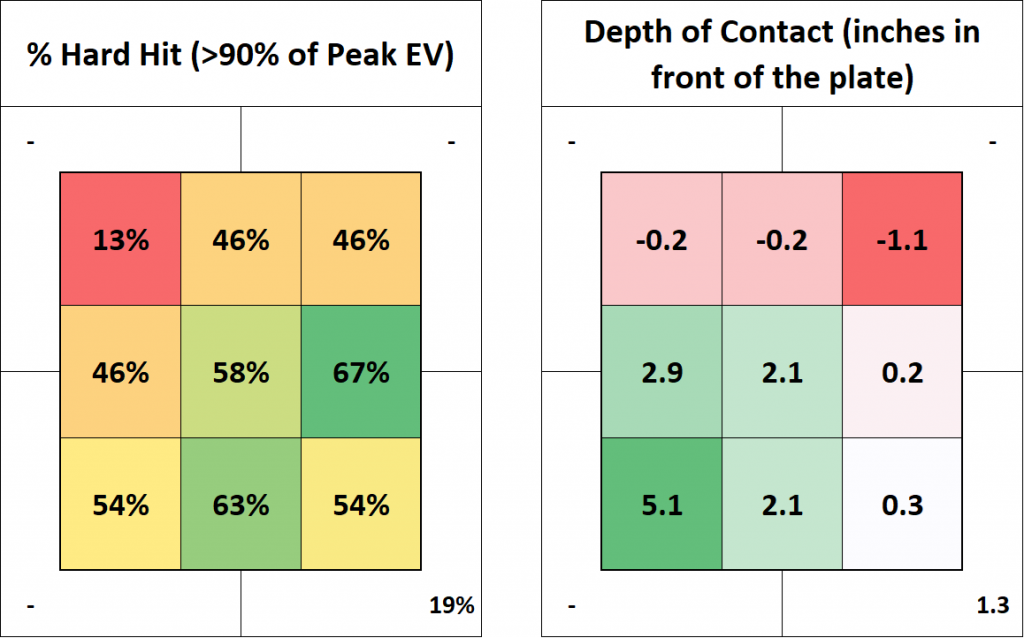
There are a variety of ways to break down the strike zone, including, among others, exit velo, launch angle, hard hit balls and depth of contact. Once again, seeing where strengths and weaknesses lay in terms of batted ball production throughout the zone may reveal a mechanical or movement flaw in the hitter’s swing.
Like the spray chart, each individual hitter will have a “hot zone” where they hit the ball the hardest with optimal trajectory. The bigger the zone, of course, the better. Zones with lower exit velocities, excessive launch angles or more mis-hits can guide the development work in the cage.
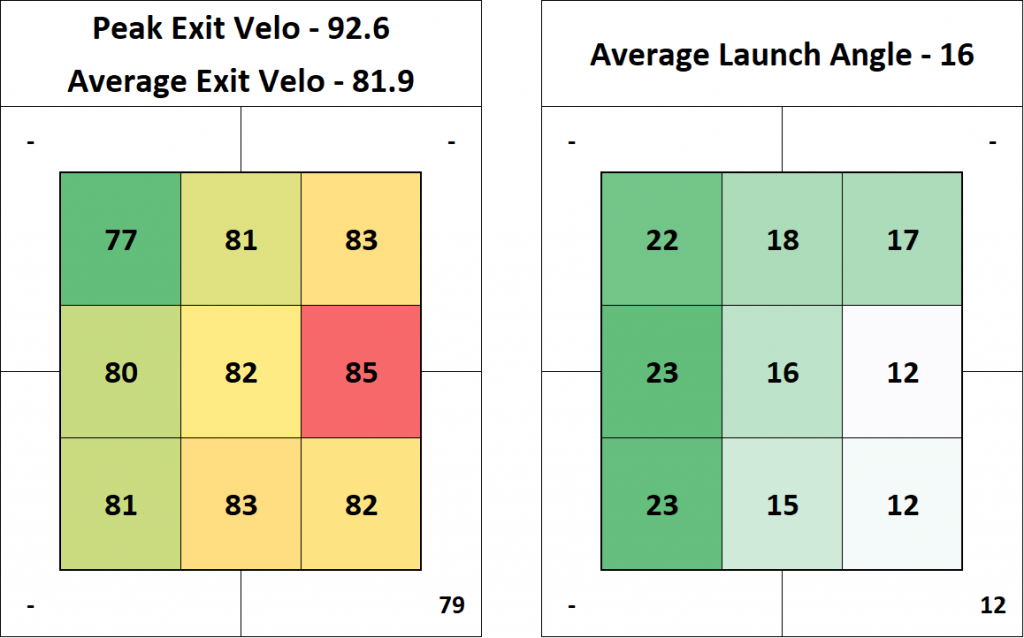
Strike zone charts also help guide a hitter’s approach as they prepare for game play. For example, let’s say we have a hitter whose most frequent hard-hit balls with optimal launch angles come on pitches in the middle and middle-inside of the zone. The hitter should probably look for pitches in this area until they get to two-strikes. Off-season work can focus on expanding this player’s “hot zone,” but going into the competition setting, he can use the data from HitTrax to make swing decisions by attacking pitches in the zones with his highest probability to produce a successful batted ball.
Summary
HitTrax is a great training tool for us here at RPP. Not only does it guide the focus for areas of development, but it informs players what their strengths are and can really help to fortify an athlete’s offensive identity at the plate. A common saying in the sports world is “ball don’t lie”. The metrics from HitTrax, if interpreted properly, can give us undeniable truths about what is happening when the ball comes off the hitter’s bat.
You live too far to train with us in-house at RPP? You can now train with us on a REMOTE basis.

You can also reach us through our various platforms or simply click below to schedule a phone call.

If you’re interested in receiving our blogs, please enter your email address below!