
With injuries on the rise in baseball, implementing a workload management system is a great way to help develop pitchers and mitigate injuries. Workload is a general term used to describe how much stress is being placed on a pitcher’s arm during both a throwing session and over a period of time (as in a week or month). Such a system can also be helpful in a variety of other ways, including:
-
- Monitoring a ramping-up
- Building overall resilience
- Managing throwing volume on specific throwing days
- Forcing recovery days through monitoring stress levels
- Managing overall volume in a throwing program
- Managing a buildup over a period of time
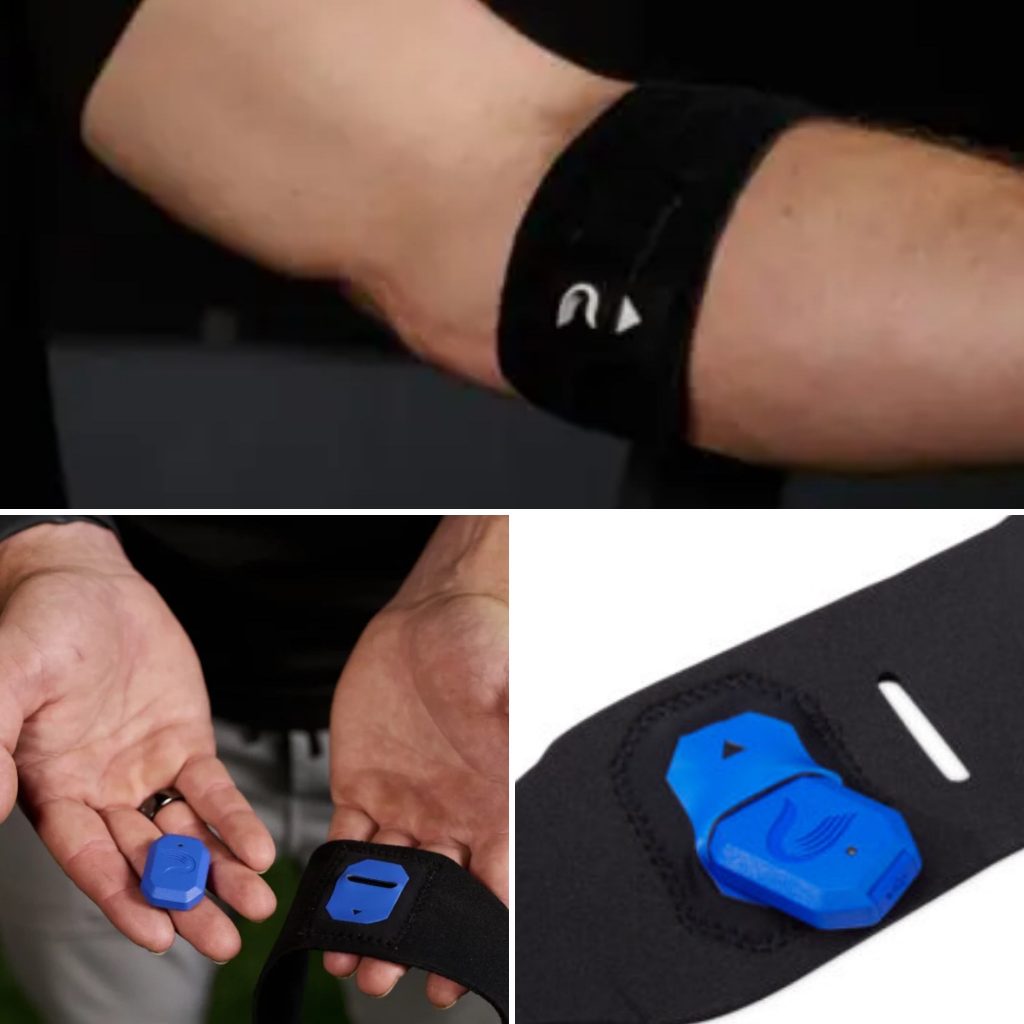
There are a couple of different workload management systems in the market, but the most popular piece is the Driveline Pulse sensor.
How Pulse Works?
The Pulse Monitor is used to track:
-
- Throwing Intensity: Arm Speed and Elbow Torque and Ball Velocity
- Throwing Volume: Throw Counts, 1-Day Workload and A:C Ratio (more on this later)
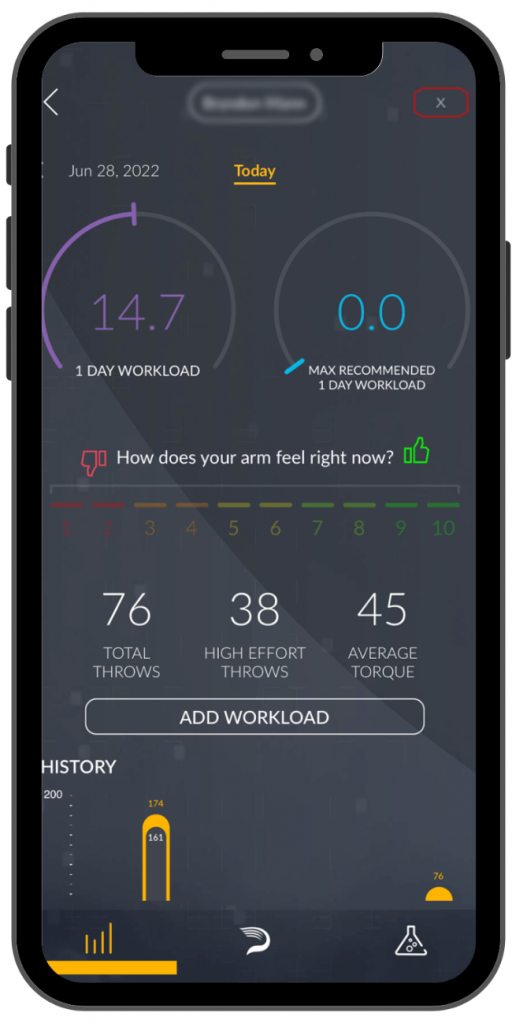
For each throw that a pitcher makes, Pulse uses the elbow torque generated from that throw, and after considering the pitcher’s height and weight, the Pulse app will calculate a 1-throw Workload Number. The sum of the 1-throw Workload Numbers is then used to make up your Daily Workload Number at the end of each throwing session.
The Daily Workload Number helps us, and the player better understands if he’s putting in the indicated amount of work (intensity and volume) during his session or if he’s under or over-training himself. We then use these numbers to calculate an acute and chronic workload number.
-
- Acute (Short Term) Workload: What IS happening; 9 day Moving Average
- Chronic (Long Term) Workload: What WAS happening; 28 day Moving Average
A:C Ratio
A:C Ratio is the Acute to Chronic Ratio of a pitcher’s workload and it represents the comparison between the Daily Workload over the last 9 days vs. the average for the prior 28 days, hence the 9 and 28 moving averages mentioned prior.
In this model, one will look at the 28 most recent days of throwing (adding the newest throwing day and dropping the oldest) and divide those days’ Acute Workload by its Chronic Workload. We measure an athlete’s A:C ratio in Workload Units (WU). The most recent throwing day will be weighted the most, as it has the most effect on the athlete’s arm.
For example:
-
- Acute: 10.4 WU
- Chronic: 10.15 WU
- A:C Ratio: 1.024
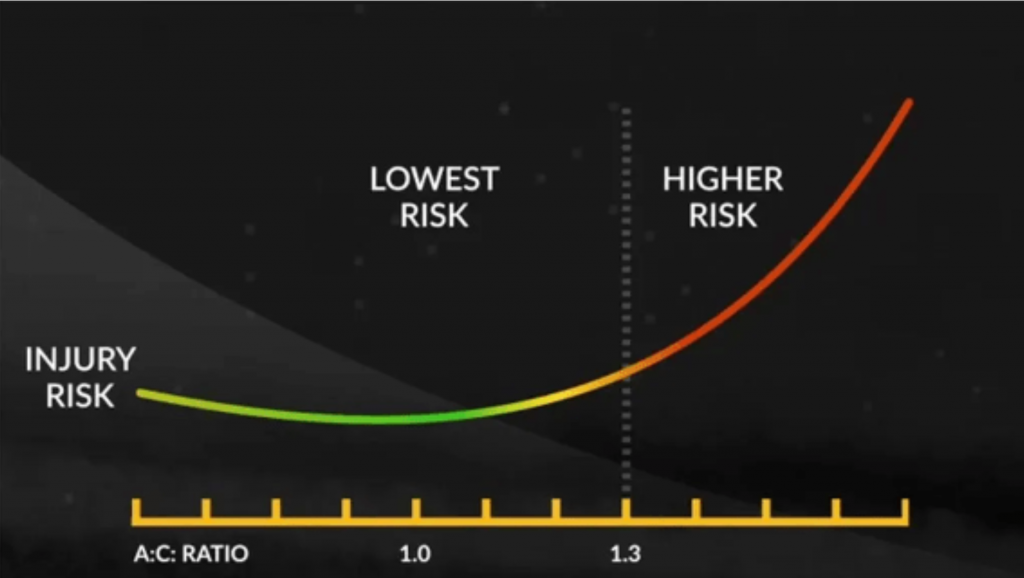
What the A:C Ratio number represents is the amount of stress the arm can handle. For instance, an A:C Ratio of 3.0 means the work that the athlete has done during the past 9 days is 3 times greater than what the arm has been doing over the past 28 days.
The ideal A:C Ratio range should be between 0.8-1.3. If their ratio falls below 0.8, it means the athlete is leaving stuff in the tank at the end of session, but if their ratio is over 1.3, then they are overexerting themselves each session. Ideally, we would like to see this number build up to 1.3 over the course of the offseason and regular season (Research: A Science Based Model For De-loading and Reloading Throwing).
Ranges
To ensure we maintain a healthy A:C Ratio, there are specific ranges for our Daily Workload that must be followed. The metric we use to measure this is Workload Units and below is the chart specified ranges for each type of throwing day:
Throwing Day / Workload Units
-
- Recovery 5-7 WU
- Long Toss 10-15 WU
- Bullpen 15-25 WU
- 1 Inning 25-35 WU
- Additional Inning 10-15 WU
Phases
Different times of year call for different types of throwing/training. Our goals for the offseason should go as follows:
-
- Early Fall: Promote Autonomy
- Late Fall: Using Sports Science, Optimize Training, Get Stronger, Light throwing
- Winter: Building Capacity, Creating a specified throwing plan to maintain a consistent workload
- Spring: Maintaining Capacity; Maintain 15 WU on average per week in season to maintain a healthy A:C Ratio (Sum of WU for the Week/# of Throwing Days)
The Winter phase is the most important in terms of throwing, building arm strength, and ultimately capacity.
Case Studies
Over the course of the offseason, we analyzed the two athletes mentioned prior, Bourke Reid and Reno Spagnoli, to see how their arm would respond to the offseason build-up.
At the beginning of the offseason, we mapped out Bourke and Reno’s throwing plans to their first day of High School Practice based on a gradual increase in workload week to week. Below is an example of an Offseason Schedules created for maintain a solid A:C Ratio in the ramp-up process:
Monday-Thursday Offseason Throwing Schedule:
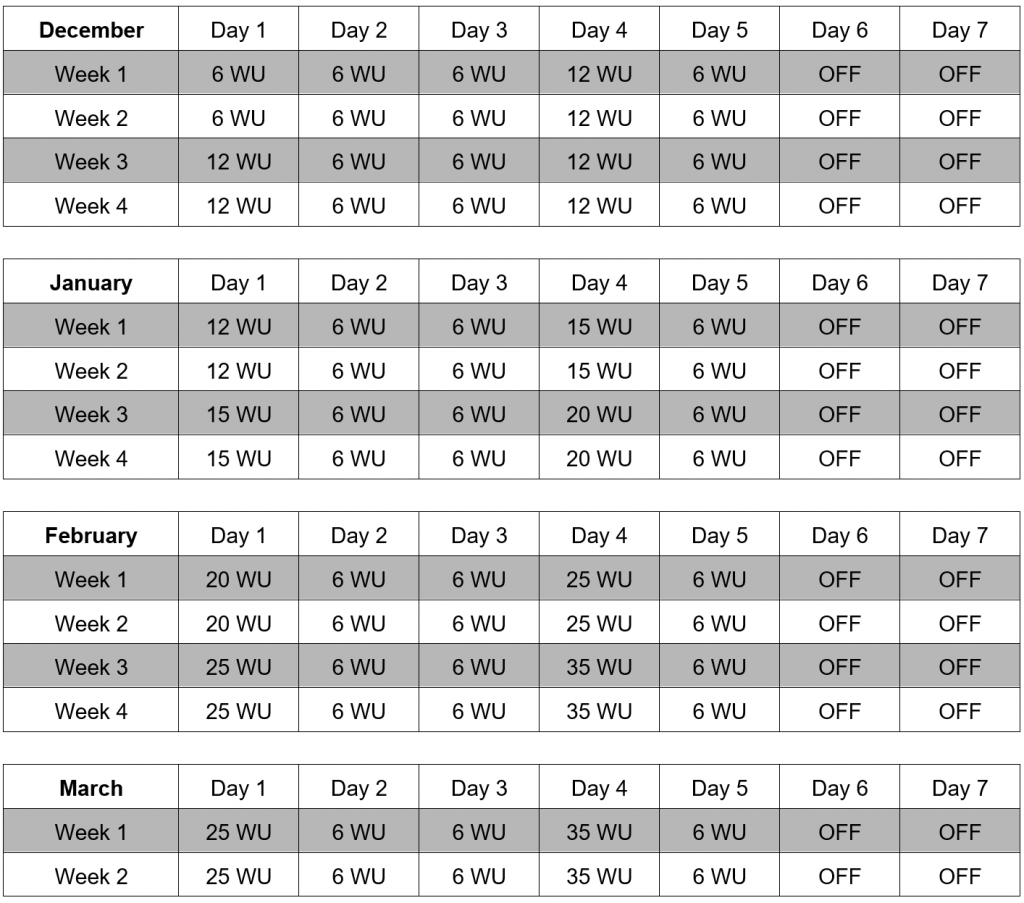
The idea behind this schedule was to set the foundation for them both to slowly increase their workload week by week. December was the Ramp-Up phase.
-
- Here we introduced volume first (how many throws they are making), then frequency (how often the athlete is throwing) to the athlete’s as we started to build capacity.
- January was the Velocity phase where we continued to introduce volume, but we now introduced intensity. The saying of the Offseason program was “The more we throw hard, the harder we will throw” and that held true through the offseason as kids began to start hitting new personal bests as we got closer to the season.
- February and the first half of March were Mound/Live ABs phase where we worked on pitch design and let the athletes compete. This is where we put volume, frequency, and intensity all together.
After collecting acute workloads (9 day moving average) and chronic workloads (28 day moving average), we reached our first A:C Ratio. Remember, when calculating these moving averages, the most recent throwing day was weighted more than one prior, and more than the one prior than that, and so on. Both athletes were at a ratio of 1.04 after the first 28 throwing days. Every day after that generated a new A:C Ratio until we reach the end of the offseason.
Bourke finished the offseason with a ratio of 1.21 and Reno had a ratio of 1.23, putting them both in a great spot going into the season, if they continue to follow their weekly workload schedule.
Both Bourke and Reno never exhibited any pain or discomfort throughout the offseason. Not only did they feel great during the off-season, both of their velocities are also up. Bourke touching 87 (up from 80 last summer) and Reno up to 95 (from topping out at 92 the previous fall).
Summary
As highlighted earlier, the main objective behind implementing a workload management system is to help mitigate injuries. It is safe to say the implementation of the Pulse at RPP has been a great success and will continue to be used as a part of not only our offseason model, but our summer program as well.
Bourke and Reno did an excellent job at staying diligent and stick to the schedule so kudos to them, great work guys!
By Matthew Hartshorn (Pitching Coordinator)
You live too far to train with us in-house at RPP? You can now train with us on a REMOTE basis.

You can also reach us through our various platforms or simply click below to schedule a phone call.

If you’re interested in receiving our blogs, please enter your email address below!